| Microsoft Office Excel 2007 Tutorial » Chart » Chart Edit |
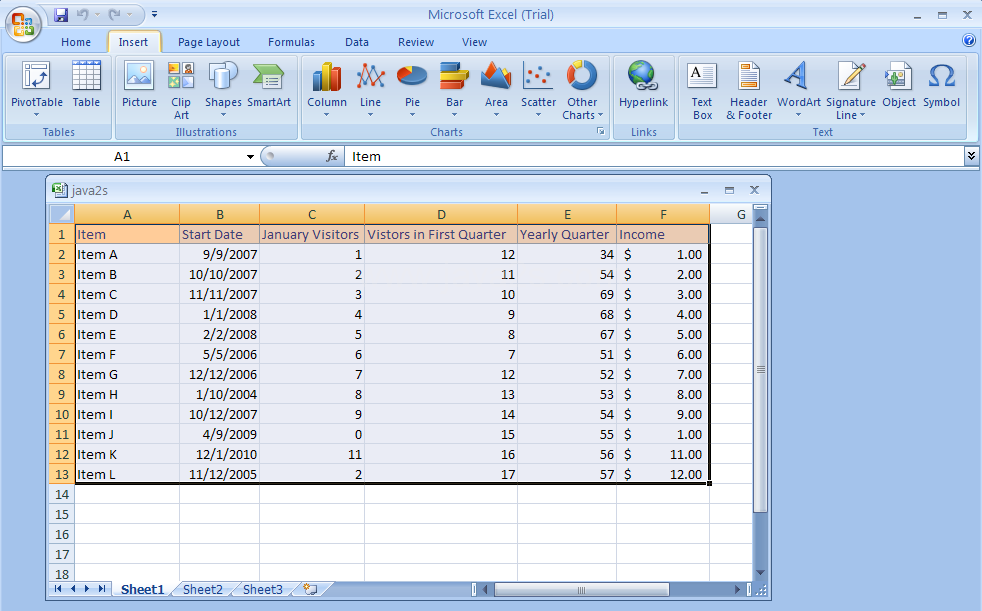
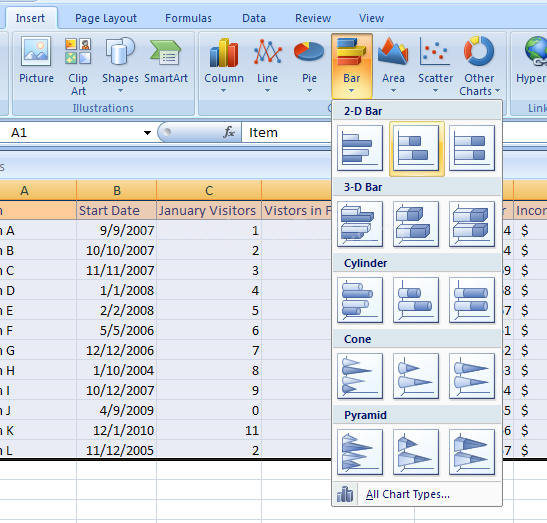
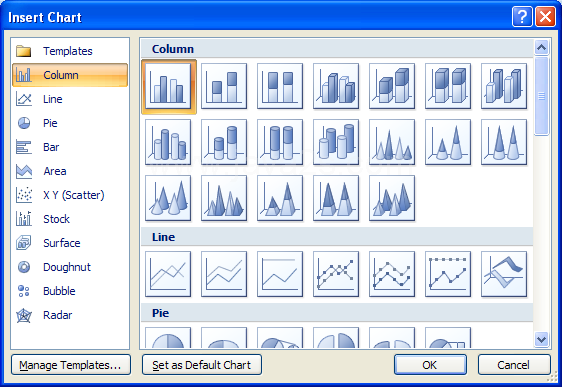
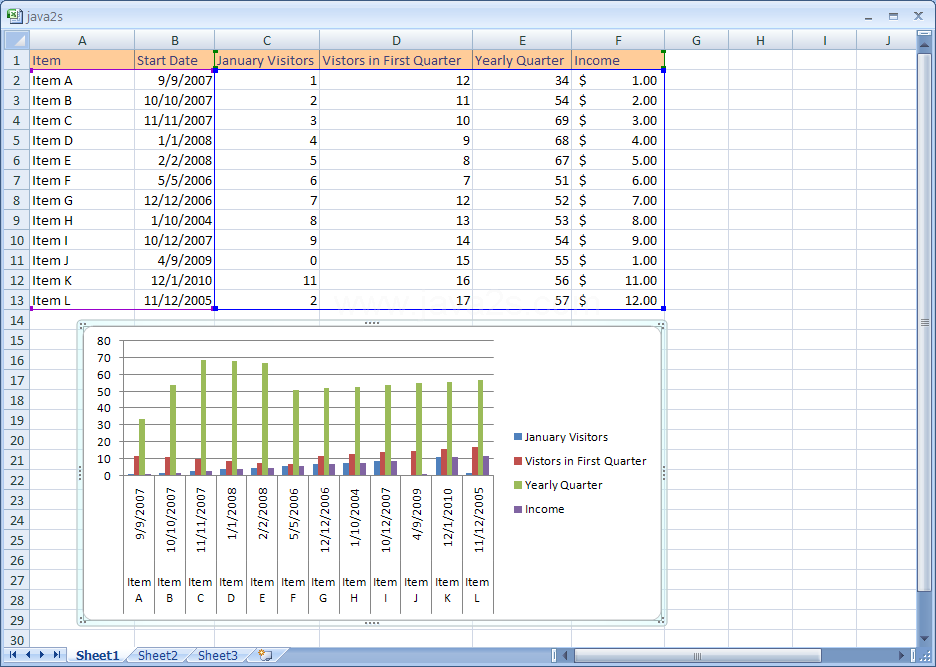
| 5.2.1.Insert and Create a Chart | |
| |
 | |
| |
 | |
| |
 | |
| |
 | |
| |
 |
| 5.2.Chart Edit | ||||
| 5.2.1. | Insert and Create a Chart | |||
| 5.2.2. | To move the chart to a chart sheet | |||
| 5.2.3. | To move the chart to another worksheet as an embedded object | |||
| 5.2.4. | Move an Embedded Chart | |||
| 5.2.5. | Resize an Embedded Chart | |||
| 5.2.6. | Delete a chart | |||