| Microsoft Office Excel 2007 Tutorial » Chart » Chart Data |
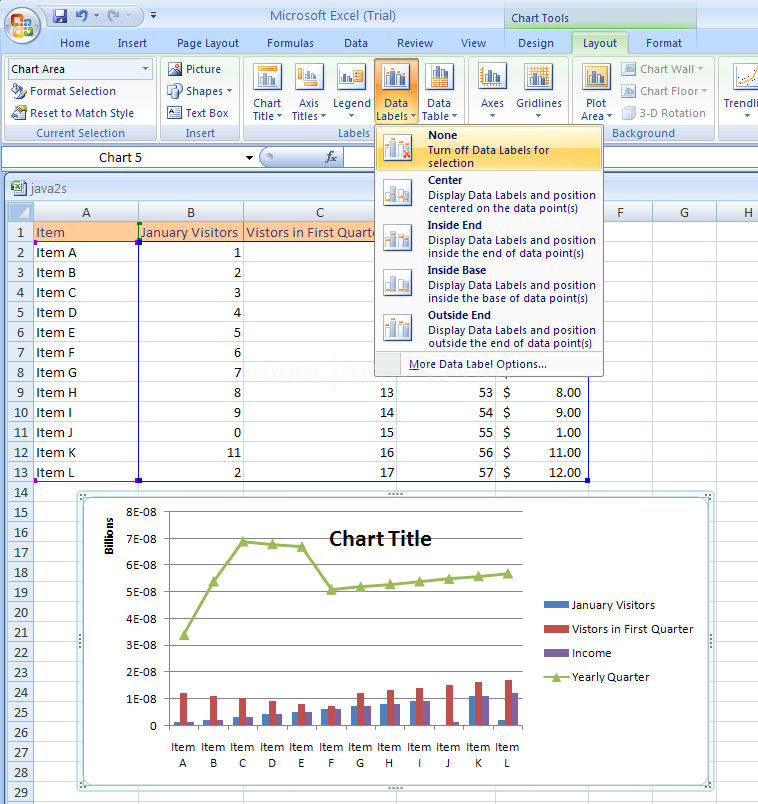
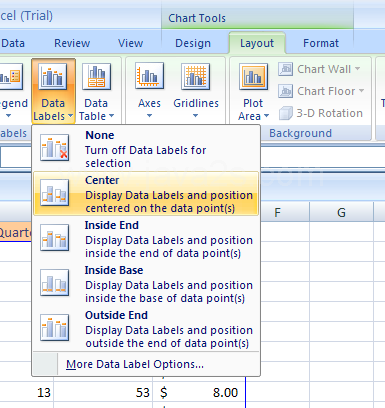
| 5.8.2.Change Chart Data Labels | |
| |
 | |
| |
 |
| 5.8.Chart Data | ||||
| 5.8.1. | Format a Chart Data Series | |||
| 5.8.2. | Change Chart Data Labels | |||
| 5.8.3. | Show or Hide a Chart Data Table | |||
| 5.8.4. | Plot data series from rows or columns | |||
| 5.8.5. | Edit the Data Source | |||
| 5.8.6. | Add a Data Series | |||
| 5.8.7. | Delete a Data Series | |||
| 5.8.8. | Change a Data Series | |||
| 5.8.9. | Change Data Series Order | |||