|
/* ===========================================================
* JFreeChart : a free chart library for the Java(tm) platform
* ===========================================================
*
* (C) Copyright 2000-2004, by Object Refinery Limited and Contributors.
*
* Project Info: http://www.jfree.org/jfreechart/index.html
*
* This library is free software; you can redistribute it and/or modify it under the terms
* of the GNU Lesser General Public License as published by the Free Software Foundation;
* either version 2.1 of the License, or (at your option) any later version.
*
* This library is distributed in the hope that it will be useful, but WITHOUT ANY WARRANTY;
* without even the implied warranty of MERCHANTABILITY or FITNESS FOR A PARTICULAR PURPOSE.
* See the GNU Lesser General Public License for more details.
*
* You should have received a copy of the GNU Lesser General Public License along with this
* library; if not, write to the Free Software Foundation, Inc., 59 Temple Place, Suite 330,
* Boston, MA 02111-1307, USA.
*
* [Java is a trademark or registered trademark of Sun Microsystems, Inc.
* in the United States and other countries.]
*
* ------------------
* PieChartDemo7.java
* ------------------
* (C) Copyright 2004, by Object Refinery Limited and Contributors.
*
* Original Author: David Gilbert (for Object Refinery Limited);
* Contributor(s): -;
*
* $Id: PieChartDemo7.java,v 1.1 2004/05/26 13:02:03 mungady Exp $
*
* Changes
* -------
* 25-May-2004 : Version 1 (DG);
*
*/
package org.jfree.chart.demo;
import java.awt.Dimension;
import java.awt.GridLayout;
import javax.swing.JPanel;
import org.jfree.chart.ChartFactory;
import org.jfree.chart.ChartPanel;
import org.jfree.chart.JFreeChart;
import org.jfree.chart.plot.PiePlot;
import org.jfree.chart.plot.PiePlot3D;
import org.jfree.data.general.DefaultPieDataset;
import org.jfree.ui.ApplicationFrame;
import org.jfree.ui.RefineryUtilities;
/**
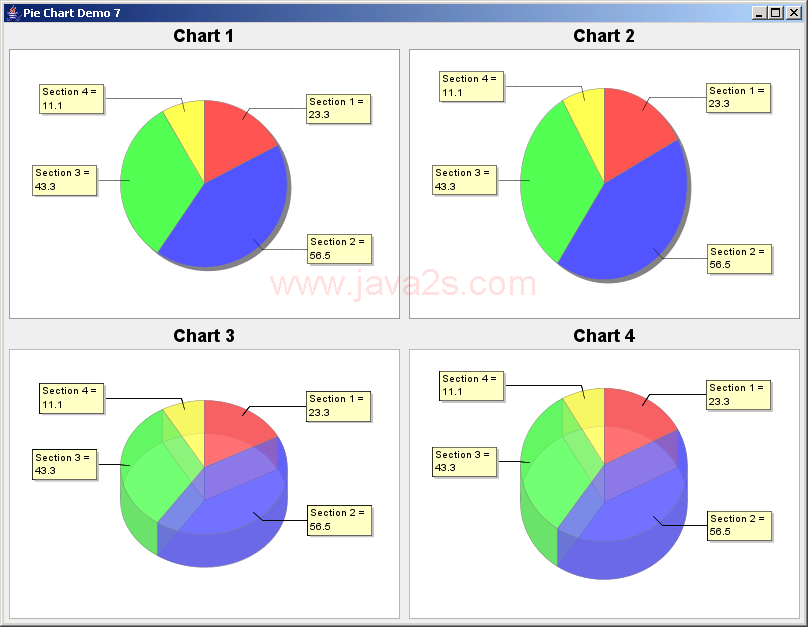
* A demo showing four pie charts.
*/
public class PieChartDemo7 extends ApplicationFrame {
/**
* Creates a new demo instance.
*
* @param title the frame title.
*/
public PieChartDemo7(String title) {
super(title);
JPanel panel = new JPanel(new GridLayout(2, 2));
DefaultPieDataset dataset = new DefaultPieDataset();
dataset.setValue("Section 1", 23.3);
dataset.setValue("Section 2", 56.5);
dataset.setValue("Section 3", 43.3);
dataset.setValue("Section 4", 11.1);
JFreeChart chart1 = ChartFactory.createPieChart("Chart 1", dataset, false, false, false);
JFreeChart chart2 = ChartFactory.createPieChart("Chart 2", dataset, false, false, false);
PiePlot plot2 = (PiePlot) chart2.getPlot();
plot2.setCircular(false);
JFreeChart chart3 = ChartFactory.createPieChart3D("Chart 3", dataset, false, false, false);
PiePlot3D plot3 = (PiePlot3D) chart3.getPlot();
plot3.setForegroundAlpha(0.6f);
plot3.setCircular(true);
JFreeChart chart4 = ChartFactory.createPieChart3D("Chart 4", dataset, false, false, false);
PiePlot3D plot4 = (PiePlot3D) chart4.getPlot();
plot4.setForegroundAlpha(0.6f);
panel.add(new ChartPanel(chart1));
panel.add(new ChartPanel(chart2));
panel.add(new ChartPanel(chart3));
panel.add(new ChartPanel(chart4));
panel.setPreferredSize(new Dimension(800, 600));
setContentPane(panel);
}
/**
* The starting point for the demo.
*
* @param args ignored.
*/
public static void main(String[] args) {
PieChartDemo7 demo = new PieChartDemo7("Pie Chart Demo 7");
demo.pack();
RefineryUtilities.centerFrameOnScreen(demo);
demo.setVisible(true);
}
}
|