|
/* ===========================================================
* JFreeChart : a free chart library for the Java(tm) platform
* ===========================================================
*
* (C) Copyright 2000-2004, by Object Refinery Limited and Contributors.
*
* Project Info: http://www.jfree.org/jfreechart/index.html
*
* This library is free software; you can redistribute it and/or modify it under the terms
* of the GNU Lesser General Public License as published by the Free Software Foundation;
* either version 2.1 of the License, or (at your option) any later version.
*
* This library is distributed in the hope that it will be useful, but WITHOUT ANY WARRANTY;
* without even the implied warranty of MERCHANTABILITY or FITNESS FOR A PARTICULAR PURPOSE.
* See the GNU Lesser General Public License for more details.
*
* You should have received a copy of the GNU Lesser General Public License along with this
* library; if not, write to the Free Software Foundation, Inc., 59 Temple Place, Suite 330,
* Boston, MA 02111-1307, USA.
*
* [Java is a trademark or registered trademark of Sun Microsystems, Inc.
* in the United States and other countries.]
*
* ------------------
* PieChartDemo4.java
* ------------------
* (C) Copyright 2003, 2004, by Object Refinery Limited and Contributors.
*
* Original Author: David Gilbert (for Object Refinery Limited);
* Contributor(s): -;
*
* $Id: PieChartDemo4.java,v 1.21 2004/06/03 15:05:10 mungady Exp $
*
* Changes
* -------
* 11-Feb-2003 : Version 1 (DG);
*
*/
package org.jfree.chart.demo;
import java.awt.Color;
import java.awt.event.ActionEvent;
import java.awt.event.ActionListener;
import java.text.NumberFormat;
import javax.swing.Timer;
import org.jfree.chart.ChartFactory;
import org.jfree.chart.ChartPanel;
import org.jfree.chart.JFreeChart;
import org.jfree.chart.labels.StandardPieItemLabelGenerator;
import org.jfree.chart.plot.PiePlot;
import org.jfree.data.general.DefaultPieDataset;
import org.jfree.data.general.PieDataset;
import org.jfree.ui.ApplicationFrame;
import org.jfree.ui.RefineryUtilities;
import org.jfree.util.Log;
import org.jfree.util.PrintStreamLogTarget;
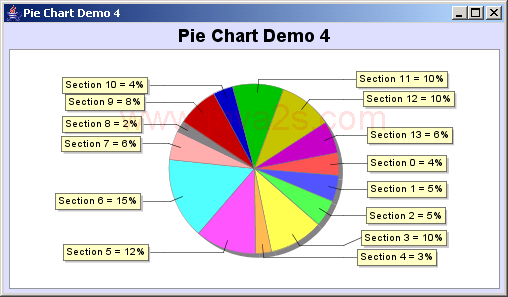
/**
* A simple demonstration application showing how to create a pie chart using data from a
* {@link DefaultPieDataset}. This chart has a lot of labels and rotates, so it is useful for
* testing the label distribution algorithm.
*/
public class PieChartDemo4 extends ApplicationFrame {
/**
* Default constructor.
*
* @param title the frame title.
*/
public PieChartDemo4(final String title) {
super(title);
final PieDataset dataset = createDataset(14);
// create the chart...
final JFreeChart chart = ChartFactory.createPieChart(
"Pie Chart Demo 4", // chart title
dataset, // dataset
false, // include legend
true,
false
);
// set the background color for the chart...
chart.setBackgroundPaint(new Color(222, 222, 255));
final PiePlot plot = (PiePlot) chart.getPlot();
plot.setBackgroundPaint(Color.white);
plot.setCircular(true);
plot.setLabelGenerator(new StandardPieItemLabelGenerator(
"{0} = {2}", NumberFormat.getNumberInstance(), NumberFormat.getPercentInstance()
));
plot.setNoDataMessage("No data available");
// add the chart to a panel...
final ChartPanel chartPanel = new ChartPanel(chart);
chartPanel.setPreferredSize(new java.awt.Dimension(500, 270));
setContentPane(chartPanel);
final Rotator rotator = new Rotator(plot);
rotator.start();
}
/**
* Creates a sample dataset.
*
* @param sections the number of sections.
*
* @return A sample dataset.
*/
private PieDataset createDataset(final int sections) {
final DefaultPieDataset result = new DefaultPieDataset();
for (int i = 0; i < sections; i++) {
final double value = 100.0 * Math.random();
result.setValue("Section " + i, value);
}
return result;
}
// ****************************************************************************
// * JFREECHART DEVELOPER GUIDE *
// * The JFreeChart Developer Guide, written by David Gilbert, is available *
// * to purchase from Object Refinery Limited: *
// * *
// * http://www.object-refinery.com/jfreechart/guide.html *
// * *
// * Sales are used to provide funding for the JFreeChart project - please *
// * support us so that we can continue developing free software. *
// ****************************************************************************
/**
* Starting point for the demonstration application.
*
* @param args ignored.
*/
public static void main(final String[] args) {
Log.getInstance().addTarget(new PrintStreamLogTarget());
final PieChartDemo4 demo = new PieChartDemo4("Pie Chart Demo 4");
demo.pack();
RefineryUtilities.centerFrameOnScreen(demo);
demo.setVisible(true);
}
/**
* The rotator.
*
*/
static class Rotator extends Timer implements ActionListener {
/** The plot. */
private PiePlot plot;
/** The angle. */
private int angle = 270;
/**
* Constructor.
*
* @param plot the plot.
*/
Rotator(final PiePlot plot) {
super(100, null);
this.plot = plot;
addActionListener(this);
}
/**
* Modifies the starting angle.
*
* @param event the action event.
*/
public void actionPerformed(final ActionEvent event) {
this.plot.setStartAngle(angle);
this.angle = this.angle + 1;
if (this.angle == 360) {
this.angle = 0;
}
}
}
}
|