|
/*************************************************************************
* *
* This source code file, and compiled classes derived from it, can *
* be used and distributed without restriction, including for commercial *
* use. (Attribution is not required but is appreciated.) *
* *
* David J. Eck *
* Department of Mathematics and Computer Science *
* Hobart and William Smith Colleges *
* Geneva, New York 14456, USA *
* Email: eck@hws.edu WWW: http://math.hws.edu/eck/ *
* *
*************************************************************************/
import java.awt.*;
import edu.hws.jcm.data.*;
import edu.hws.jcm.draw.*;
import edu.hws.jcm.awt.*;
public class GraphApplet3 extends java.applet.Applet {
public static void main(String[] a){
javax.swing.JFrame f = new javax.swing.JFrame();
java.applet.Applet app = new GraphApplet3();
app.init();
f.getContentPane().add (app);
f.pack();
f.setSize (new Dimension (500, 500));
f.setVisible(true);
}
private DisplayCanvas canvas;
public void stop() {
canvas.releaseResources();
}
public void init() {
Parser parser = new Parser();
Variable x = new Variable("x");
parser.add(x);
canvas = new DisplayCanvas();
canvas.setHandleMouseZooms(true);
canvas.add(new Panner());
CoordinateRect coords = canvas.getCoordinateRect();
LimitControlPanel limits =
new LimitControlPanel( LimitControlPanel.SET_LIMITS | LimitControlPanel.RESTORE, false);
limits.addCoords(canvas);
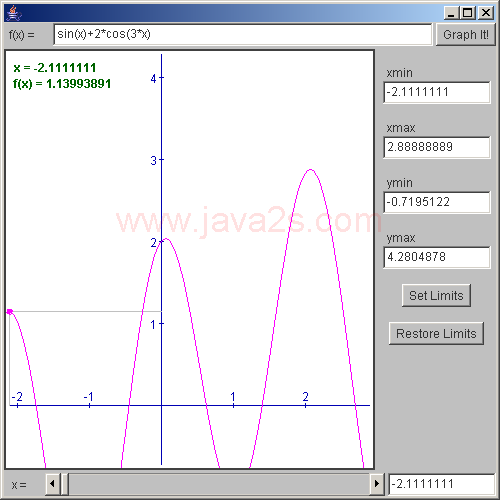
ExpressionInput input = new ExpressionInput("sin(x)+2*cos(3*x)", parser);
Function func = input.getFunction(x);
Graph1D graph = new Graph1D(func);
VariableInput xInput = new VariableInput();
VariableSlider xSlider = new VariableSlider( coords.getValueObject(CoordinateRect.XMIN),
coords.getValueObject(CoordinateRect.XMAX) );
Value yValue = new ValueMath(func,xSlider); // A Value object to represent the y-coord of the point.
// Instead of using a crosshair to mark a point on the graph, it is marked
// with two gray lines and a small magenta oval. These geometric objects
// are represented as objects belonging to the class DrawGeometric,
// which makes it possible to draw a variety of geometric figures on a
// DisplayCanvas.
DrawGeometric vLine = new DrawGeometric(DrawGeometric.LINE_ABSOLUTE,xSlider,new Constant(0),xSlider,yValue);
DrawGeometric hLine = new DrawGeometric(DrawGeometric.LINE_ABSOLUTE,new Constant(0),yValue,xSlider,yValue);
DrawGeometric point = new DrawGeometric(DrawGeometric.OVAL_CENTERED,xSlider,yValue,3,3);
vLine.setColor(Color.lightGray);
hLine.setColor(Color.lightGray);
point.setColor(Color.magenta);
point.setFillColor(Color.magenta);
DrawString info = new DrawString("x = #\nf(x) = #", DrawString.TOP_LEFT,
new Value[] { xSlider, yValue });
info.setFont( new Font("SansSerif",Font.BOLD,12) );
info.setColor( new Color(0,100,0) );
info.setOffset(10);
ComputeButton graphIt = new ComputeButton("Graph It!");
setLayout(new BorderLayout(3,3));
setBackground(Color.lightGray);
// In this version of the applet, I have built the interface from
// regular Panels instead of JCMPanels. This puts responsibility
// for a lot more setup in the hands of the programmer. The gain
// is in efficiency. Here, my object is to avoid recomputing the
// graph just because the user adjusts the slider. To do this,
// I have to use two controllers, which listen for different user
// actions. (Of course, computers are so fast now that the extra
// computation probably doesn't add a perceptible delay. In this
// case, the extra design work is probably not worth the trouble.)
Panel top = new Panel();
top.setLayout(new BorderLayout(3,3));
Panel bottom = new Panel();
bottom.setLayout(new BorderLayout(3,3));
add(canvas, BorderLayout.CENTER); // Add components directly to the applet.
add(limits, BorderLayout.EAST);
add(bottom, BorderLayout.SOUTH);
add(top, BorderLayout.NORTH);
top.add(input, BorderLayout.CENTER);
top.add(new Label(" f(x) = "), BorderLayout.WEST);
top.add(graphIt, BorderLayout.EAST);
bottom.add(xSlider, BorderLayout.CENTER);
bottom.add(xInput, BorderLayout.EAST);
bottom.add(new Label(" x = "), BorderLayout.WEST);
canvas.add( new Axes() );
canvas.add( hLine );
canvas.add( vLine );
canvas.add( point );
canvas.add( graph );
canvas.add( info );
canvas.add( new DrawBorder(Color.darkGray, 2) );
Controller cc = new Controller(); // This controller will listen for changes
xInput.setOnUserAction(cc); // In the VariableSlider or VariableInput,
xSlider.setOnUserAction(cc); // As well as in the limits on the coordinates.
coords.setOnChange(cc);
cc.add( new Tie(xSlider,xInput) ); // Ties the values of the slider and VariableInput.
cc.add( hLine ); // I have to tell the controller which objects need to be recomputed
cc.add( vLine ); // when it sees some kind of change. This includes all the
cc.add( point ); // objects that depend on the x-coordinate. Note that is ALSO
cc.add( info ); // includes xInput and xSlider, which need to be checked for
cc.add( xInput ); // changes in their values. The value associated with a
cc.add( xSlider ); // VariableSlider or VariableInput doesn't actually change
// until a Controller checks it. (All this is the part of the
// setup that is done automatically when you build your
// interface from JCMPanels.)
Controller gc = new Controller(); // This controller will listen for changes
input.setOnUserAction(gc); // in the function definition.
graphIt.setOnUserAction(gc);
gc.add(input); // I have to add the ExpressionInput to a Controller, since the
// function doesn't actually change unless the ExpressionInput
// is checked by a Controller.
gc.add(graph); // The graph needs to be recomputed when the function changes.
gc.add(cc); // You can add one Controller to another. Here, gc will call
// on cc to do all its checks and computations, in addition to.
// recomputing the graph.
gc.setErrorReporter(canvas); // Set error reporters for the Controller.
// This error reporter is also used by
// cc, which has been added as a subcontroller
// to gc. So, it's not necessary to set a separate
// error reporter for cc
limits.setErrorReporter(canvas); // Error reporter for the LimitControlPanel.
} // end init()
} // end class SimpleGraph3
|