|
/*************************************************************************
* *
* This source code file, and compiled classes derived from it, can *
* be used and distributed without restriction, including for commercial *
* use. (Attribution is not required but is appreciated.) *
* *
* David J. Eck *
* Department of Mathematics and Computer Science *
* Hobart and William Smith Colleges *
* Geneva, New York 14456, USA *
* Email: eck@hws.edu WWW: http://math.hws.edu/eck/ *
* *
*************************************************************************/
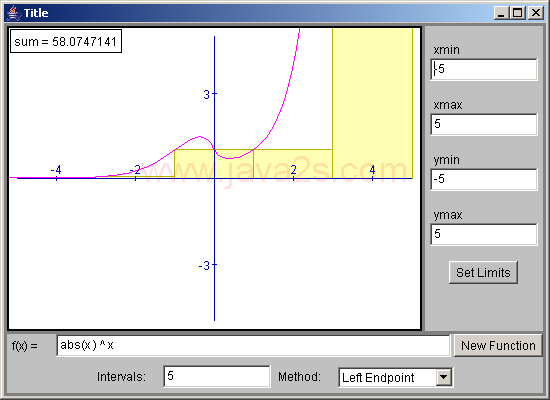
// The SimpleGraph applet is a configurable applet that displays the graph of
// a single function of one variable and computes a Riemann sum for that
// function.
import java.awt.*;
import java.awt.event.*;
import java.applet.Applet;
import java.util.StringTokenizer;
import edu.hws.jcm.draw.*;
import edu.hws.jcm.data.*;
import edu.hws.jcm.functions.*;
import edu.hws.jcm.awt.*;
public class RiemannSums extends GenericGraphApplet {
// Declare some private variables that are created in one method in
// this class and used in a second method.
private Variable intervals; // Gives the number of intervals.
private VariableInput intCtInput; // For letting the user enter the number of intervals.
private Choice methodChoice; // Gives the method to be used: Left Endpoint, ..., Trapezoid.
private Function func; // The function that is graphed.
private Graph1D graph; // The graph of the function.
private RiemannSumRects sums;
public void itemStateChanged(ItemEvent evt) {
// React when user changes the summation method.
if (evt.getSource() == methodChoice) {
sums.setMethod(methodChoice.getSelectedIndex());
mainController.compute();
}
else
super.itemStateChanged(evt);
}
protected void setUpParameterDefaults() { // Override to give a different default function
parameterDefaults = new java.util.Hashtable();
String func = " 3 / (1 + " + getParameter("Variable","x") + "^2)";
parameterDefaults.put("Function",func);
parameterDefaults.put("ComputeButtonName","Compute!");
}
protected void setUpCanvas() { // Override this to add more stuff to the canvas.
// When setUpCanvas is called, the functionInput already exists, if one is
// to be used, since it is created in setUpBopttomPanel(), which is called
// before setUpCanvas. If functionInput exists, add a graph of the function
// from functionInput to the canvas. If not, create a graph of the function
// specified by the parameter named "Function".
if (functionInput != null)
func = functionInput.getFunction(xVar);
else {
String def = getParameter("Function", " abs(" + xVar.getName() + ") ^ " + xVar.getName());
Function f = new SimpleFunction( parser.parse(def), xVar );
func = new WrapperFunction(f);
}
graph = new Graph1D(func);
Color color = getColorParam("GraphColor");
if (color != null)
graph.setColor(color);
// Get the data for the RiemannSumRects object. Create it (along with other
// associated objects) and add it to the canvas.
double[] intCtD = getNumericParam("IntervalCount");
if (intCtD == null || intCtD.length < 1)
intCtD = new double[] { 5 };
else if (Double.isNaN(intCtD[0]) || intCtD[0] < 1 || intCtD[0] > 5000)
intCtD[0] = 5;
int intCt = (int)(intCtD[0]+0.5);
if ("yes".equalsIgnoreCase( getParameter("UseIntervalInput", "yes") )){
intCtInput = new VariableInput(null, "" + intCt);
intCtInput.setInputStyle(VariableInput.INTEGER);
intCtInput.setMin(1);
intCtInput.setMax(5000);
intervals = intCtInput.getVariable();
}
else
intervals = new Variable(null,intCt);
int method = RiemannSumRects.LEFTENDPOINT;
String methodStr = getParameter("Method");
if (methodStr != null && methodStr.trim().length() > 0) {
switch (methodStr.trim().charAt(0)) {
case 'L': case 'l': method = RiemannSumRects.LEFTENDPOINT; break;
case 'R': case 'r': method = RiemannSumRects.RIGHTENDPOINT; break;
case 'M': case 'm': method = RiemannSumRects.MIDPOINT; break;
case 'C': case 'c': method = RiemannSumRects.CIRCUMSCRIBED; break;
case 'I': case 'i': method = RiemannSumRects.INSCRIBED; break;
case 'T': case 't': method = RiemannSumRects.TRAPEZOID; break;
}
}
if ("yes".equalsIgnoreCase( getParameter("UseMethodInput", "yes") )) {
methodChoice = new Choice();
methodChoice.add("Left Endpoint");
methodChoice.add("Right Endpoint");
methodChoice.add("Midpoint");
methodChoice.add("~Circumscribed");
methodChoice.add("~Inscribed");
methodChoice.add("Trapezoid");
methodChoice.select(method);
methodChoice.addItemListener(this);
}
sums = new RiemannSumRects(func,intervals);
sums.setMethod(method);
canvas.add(sums);
Color c = getColorParam("RectColor");
if (c != null)
sums.setColor(c);
c = getColorParam("OutlineColor");
if (c != null)
sums.setOutlineColor(c);
super.setUpCanvas(); // Do the common setup: Add the axes, for example.
canvas.getCoordinateRect().setGap(10); // Extra space around edges.
canvas.add(graph); // Add the graph to the canvas.
// Add a DrawString to the canvas to show the value of the sum.
DrawString ds = new DrawString("sum = #", DrawString.TOP_LEFT,
new Value[] { sums.getValueObject(RiemannSumRects.CURRENT_METHOD) } );
ds.setBackgroundColor(getColorParam("TextBackground",Color.white));
ds.setColor(getColorParam("TextColor",Color.black));
ds.setFrameWidth(1);
canvas.add(ds);
mainController.add(ds);
mainController.add(sums);
if (intCtInput != null)
intCtInput.setOnUserAction(mainController);
canvas.getCoordinateRect().setOnChange(mainController);
} // end setUpCanvas()
protected void setUpMainPanel() {
// Override this method to add the methodChoice menu and interval count inputs, if any,
// to the panel. (They were created in the setUpCanvas method.)
super.setUpMainPanel(); // Do the common setup
if (methodChoice == null && intCtInput == null)
return;
JCMPanel panel = new JCMPanel();
panel.setLayout(new FlowLayout());
panel.setBackground(getColorParam("PanelBackground",Color.lightGray));
if (intCtInput != null) {
panel.add(new Label("Intervals:"));
panel.add(intCtInput);
}
if (methodChoice != null) {
panel.add(new Label("Method:"));
panel.add(methodChoice);
}
if (inputPanel == null)
mainPanel.add(panel, BorderLayout.SOUTH);
else {
inputPanel.setBackground(getColorParam("PanelBackground",Color.lightGray));
inputPanel.add(panel, BorderLayout.SOUTH);
}
} // end setUpMainPanel()
protected void doLoadExample(String example) {
// This method is called when the user loads an example from the
// example menu (if there is one). It overrides an empty method
// in GenericGraphApplet.
// For this applet, the example string should contain
// an expression that defines the function to be graphed.
// This can optionally be followed by a semicoloon and a list of four or five
// numbers. The first four numbers give the x- and y- limes to be used for the
// example. The fifth number, if present, gives the interval count.
// After the numbers, there can be another semicolon
// and the name of the summation method to be used.
int pos = example.indexOf(";");
double[] limits = { -5,5,-5,5 }; // x- and y-limits to use
if (pos > 0) { // get limits, method from example text
String limitsText = example.substring(pos+1);
example = example.substring(0,pos);
pos = limitsText.indexOf(";");
if (pos > 0) { // data includes a method name.
String methodStr = limitsText.substring(pos+1).trim();
limitsText = limitsText.substring(0,pos);
if (methodStr.length() > 0) {
int method;
switch (methodStr.charAt(0)) {
case 'L': case 'l': method = RiemannSumRects.LEFTENDPOINT; break;
case 'R': case 'r': method = RiemannSumRects.RIGHTENDPOINT; break;
case 'M': case 'm': method = RiemannSumRects.MIDPOINT; break;
case 'C': case 'c': method = RiemannSumRects.CIRCUMSCRIBED; break;
case 'I': case 'i': method = RiemannSumRects.INSCRIBED; break;
case 'T': case 't': method = RiemannSumRects.TRAPEZOID; break;
default: method = -1;
}
if (method >= 0) {
sums.setMethod(method);
if (methodChoice != null)
methodChoice.select(method);
}
}
}
StringTokenizer toks = new StringTokenizer(limitsText, " ,");
if (toks.countTokens() >= 4) {
for (int i = 0; i < 4; i++) {
try {
Double d = new Double(toks.nextToken());
limits[i] = d.doubleValue();
}
catch (NumberFormatException e) {
}
}
if (toks.countTokens() > 0) {
// get number of intervals
try {
Double d = new Double(toks.nextToken());
double intCtD = d.doubleValue();
if (intCtD < 1)
intCtD = 1;
else if (intCtD > 5000)
intCtD = 5000;
intervals.setVal((int)(intCtD + 0.5));
}
catch (NumberFormatException e) {
}
}
}
}
// Set up the example data and recompute everything.
if (functionInput != null) {
// If there is a function input box, put the example text in it.
functionInput.setText(example);
}
else {
// If there is no user input, set the function in the graph directly.
// Also, in this case, func is a "WrapperFunction". Set the
// definition of that WrapperFunction to be the same as f
try {
Function f = new SimpleFunction( parser.parse(example), xVar );
((WrapperFunction)func).setFunction(f);
}
catch (ParseError e) {
// There should't be parse error's in the Web-page
// author's examples! If there are, the function
// just won't change.
}
}
CoordinateRect coords = canvas.getCoordinateRect(0);
coords.setLimits(limits);
coords.setRestoreBuffer();
mainController.compute();
} // end doLoadExample()
public static void main(String[] a){
javax.swing.JFrame f = new javax.swing.JFrame();
Applet app = new RiemannSums();
app.init();
f.getContentPane().add (app);
f.pack();
f.setSize (new Dimension (500, 500));
f.setVisible(true);
}
} // end class RiemannSums
|