|
/*
Java Swing, 2nd Edition
By Marc Loy, Robert Eckstein, Dave Wood, James Elliott, Brian Cole
ISBN: 0-596-00408-7
Publisher: O'Reilly
*/
// ChartTester.java
//A test harness for the various table charting classes. (see
//ChartPainter.java, PieChartPainter.java, TableChart.java and
//TableChartPopup.java)
//
import java.awt.BorderLayout;
import java.awt.Color;
import java.awt.Dimension;
import java.awt.Font;
import java.awt.Graphics;
import java.awt.event.ActionEvent;
import java.awt.event.ActionListener;
import java.awt.event.MouseEvent;
import javax.swing.JButton;
import javax.swing.JComponent;
import javax.swing.JFrame;
import javax.swing.JScrollPane;
import javax.swing.JTable;
import javax.swing.SwingUtilities;
import javax.swing.ToolTipManager;
import javax.swing.event.TableModelEvent;
import javax.swing.event.TableModelListener;
import javax.swing.plaf.ComponentUI;
import javax.swing.table.AbstractTableModel;
import javax.swing.table.TableModel;
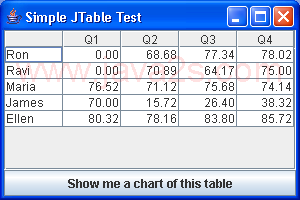
public class ChartTester extends JFrame {
public ChartTester() {
super("Simple JTable Test");
setSize(300, 200);
setDefaultCloseOperation(EXIT_ON_CLOSE);
TableModel tm = new AbstractTableModel() {
String data[][] = { { "Ron", "0.00", "68.68", "77.34", "78.02" },
{ "Ravi", "0.00", "70.89", "64.17", "75.00" },
{ "Maria", "76.52", "71.12", "75.68", "74.14" },
{ "James", "70.00", "15.72", "26.40", "38.32" },
{ "Ellen", "80.32", "78.16", "83.80", "85.72" } };
String headers[] = { "", "Q1", "Q2", "Q3", "Q4" };
public int getColumnCount() {
return headers.length;
}
public int getRowCount() {
return data.length;
}
public String getColumnName(int col) {
return headers[col];
}
public Class getColumnClass(int col) {
return (col == 0) ? String.class : Number.class;
}
public boolean isCellEditable(int row, int col) {
return true;
}
public Object getValueAt(int row, int col) {
return data[row][col];
}
public void setValueAt(Object value, int row, int col) {
data[row][col] = (String) value;
fireTableRowsUpdated(row, row);
}
};
JTable jt = new JTable(tm);
JScrollPane jsp = new JScrollPane(jt);
getContentPane().add(jsp, BorderLayout.CENTER);
final TableChartPopup tcp = new TableChartPopup(tm);
JButton button = new JButton("Show me a chart of this table");
button.addActionListener(new ActionListener() {
public void actionPerformed(ActionEvent ae) {
tcp.setVisible(true);
}
});
getContentPane().add(button, BorderLayout.SOUTH);
}
public static void main(String args[]) {
ChartTester ct = new ChartTester();
ct.setVisible(true);
}
}
//TableChartPopup.java
//A popup framework for showing a chart of table data. This class also
//turns on tooltips for the chart.
//
class TableChartPopup extends JFrame {
public TableChartPopup(TableModel tm) {
super("Table Chart");
setSize(300, 200);
TableChart tc = new TableChart(tm);
getContentPane().add(tc, BorderLayout.CENTER);
// Use the next line to turn on tooltips:
ToolTipManager.sharedInstance().registerComponent(tc);
}
}
//TableChart.java
//A chart-generating class that uses the TableModel interface to get
//its data.
//
class TableChart extends JComponent implements TableModelListener {
protected TableModel model;
protected ChartPainter cp;
protected double[] percentages; // pie slices
protected String[] labels; // labels for slices
protected String[] tips; // tooltips for slices
protected java.text.NumberFormat formatter = java.text.NumberFormat
.getPercentInstance();
public TableChart(TableModel tm) {
setUI(cp = new PieChartPainter());
setModel(tm);
}
public void setTextFont(Font f) {
cp.setTextFont(f);
}
public Font getTextFont() {
return cp.getTextFont();
}
public void setTextColor(Color c) {
cp.setTextColor(c);
}
public Color getTextColor() {
return cp.getTextColor();
}
public void setColor(Color[] clist) {
cp.setColor(clist);
}
public Color[] getColor() {
return cp.getColor();
}
public void setColor(int index, Color c) {
cp.setColor(index, c);
}
public Color getColor(int index) {
return cp.getColor(index);
}
public String getToolTipText(MouseEvent me) {
if (tips != null) {
int whichTip = cp.indexOfEntryAt(me);
if (whichTip != -1) {
return tips[whichTip];
}
}
return null;
}
public void tableChanged(TableModelEvent tme) {
// Rebuild the arrays only if the structure changed.
updateLocalValues(tme.getType() != TableModelEvent.UPDATE);
}
public void setModel(TableModel tm) {
// get listener code correct.
if (tm != model) {
if (model != null) {
model.removeTableModelListener(this);
}
model = tm;
model.addTableModelListener(this);
updateLocalValues(true);
}
}
public TableModel getModel() {
return model;
}
// Run through the model and count every cell (except the very first column,
// which we assume is the slice label column).
protected void calculatePercentages() {
double runningTotal = 0.0;
for (int i = model.getRowCount() - 1; i >= 0; i--) {
percentages[i] = 0.0;
for (int j = model.getColumnCount() - 1; j >= 0; j--) {
// First try the cell as a Number object.
Object val = model.getValueAt(i, j);
if (val instanceof Number) {
percentages[i] += ((Number) val).doubleValue();
} else if (val instanceof String) {
// oops, it wasn't numeric...
// Ok, so try it as a string
try {
percentages[i] += Double.valueOf(val.toString())
.doubleValue();
} catch (Exception e) {
// not a numeric string...give up.
}
}
}
runningTotal += percentages[i];
}
// Make each entry a percentage of the total.
for (int i = model.getRowCount() - 1; i >= 0; i--) {
percentages[i] /= runningTotal;
}
}
// This method just takes the percentages and formats them for use as
// tooltips.
protected void createLabelsAndTips() {
for (int i = model.getRowCount() - 1; i >= 0; i--) {
labels[i] = (String) model.getValueAt(i, 0);
tips[i] = formatter.format(percentages[i]);
}
}
// Call this method to update the chart. We try to be a bit efficient here
// in that we allocate new storage arrays only if the new table has a
// different number of rows.
protected void updateLocalValues(boolean freshStart) {
if (freshStart) {
int count = model.getRowCount();
if ((tips == null) || (count != tips.length)) {
percentages = new double[count];
labels = new String[count];
tips = new String[count];
}
}
calculatePercentages();
createLabelsAndTips();
// Now that everything's up-to-date, reset the chart painter with the
// new
// values.
cp.setValues(percentages);
cp.setLabels(labels);
// Finally, repaint the chart.
repaint();
}
}
//PieChartPainter.java
//A pie chart implementation of the ChartPainter class.
//
class PieChartPainter extends ChartPainter {
protected static PieChartPainter chartUI = new PieChartPainter();
protected int originX, originY;
protected int radius;
private static double piby2 = Math.PI / 2.0;
private static double twopi = Math.PI * 2.0;
private static double d2r = Math.PI / 180.0; // Degrees to radians.
private static int xGap = 5;
private static int inset = 40;
public int indexOfEntryAt(MouseEvent me) {
int x = me.getX() - originX;
int y = originY - me.getY(); // Upside-down coordinate system.
// Is (x,y) in the circle?
if (Math.sqrt(x * x + y * y) > radius) {
return -1;
}
double percent = Math.atan2(Math.abs(y), Math.abs(x));
if (x >= 0) {
if (y <= 0) { // (IV)
percent = (piby2 - percent) + 3 * piby2; // (IV)
}
} else {
if (y >= 0) { // (II)
percent = Math.PI - percent;
} else { // (III)
percent = Math.PI + percent;
}
}
percent /= twopi;
double t = 0.0;
if (values != null) {
for (int i = 0; i < values.length; i++) {
if (t + values[i] > percent) {
return i;
}
t += values[i];
}
}
return -1;
}
public void paint(Graphics g, JComponent c) {
Dimension size = c.getSize();
originX = size.width / 2;
originY = size.height / 2;
int diameter = (originX < originY ? size.width - inset : size.height
- inset);
radius = (diameter / 2) + 1;
int cornerX = (originX - (diameter / 2));
int cornerY = (originY - (diameter / 2));
int startAngle = 0;
int arcAngle = 0;
for (int i = 0; i < values.length; i++) {
arcAngle = (int) (i < values.length - 1 ? Math
.round(values[i] * 360) : 360 - startAngle);
g.setColor(colors[i % colors.length]);
g.fillArc(cornerX, cornerY, diameter, diameter, startAngle,
arcAngle);
drawLabel(g, labels[i], startAngle + (arcAngle / 2));
startAngle += arcAngle;
}
g.setColor(Color.black);
g.drawOval(cornerX, cornerY, diameter, diameter); // Cap the circle.
}
public void drawLabel(Graphics g, String text, double angle) {
g.setFont(textFont);
g.setColor(textColor);
double radians = angle * d2r;
int x = (int) ((radius + xGap) * Math.cos(radians));
int y = (int) ((radius + xGap) * Math.sin(radians));
if (x < 0) {
x -= SwingUtilities.computeStringWidth(g.getFontMetrics(), text);
}
if (y < 0) {
y -= g.getFontMetrics().getHeight();
}
g.drawString(text, x + originX, originY - y);
}
public static ComponentUI createUI(JComponent c) {
return chartUI;
}
}
//ChartPainter.java
//A simple chart-drawing UI base class. This class tracks the basic fonts
//and colors for various types of charts including pie and bar. The paint()
//method is abstract and must be implemented by subclasses for each type.
//
abstract class ChartPainter extends ComponentUI {
protected Font textFont = new Font("Serif", Font.PLAIN, 12);
protected Color textColor = Color.black;
protected Color colors[] = new Color[] { Color.red, Color.blue,
Color.yellow, Color.black, Color.green, Color.white, Color.gray,
Color.cyan, Color.magenta, Color.darkGray };
protected double values[] = new double[0];
protected String labels[] = new String[0];
public void setTextFont(Font f) {
textFont = f;
}
public Font getTextFont() {
return textFont;
}
public void setColor(Color[] clist) {
colors = clist;
}
public Color[] getColor() {
return colors;
}
public void setColor(int index, Color c) {
colors[index] = c;
}
public Color getColor(int index) {
return colors[index];
}
public void setTextColor(Color c) {
textColor = c;
}
public Color getTextColor() {
return textColor;
}
public void setLabels(String[] l) {
labels = l;
}
public void setValues(double[] v) {
values = v;
}
public abstract int indexOfEntryAt(MouseEvent me);
public abstract void paint(Graphics g, JComponent c);
}
|