|
/* ===========================================================
* JFreeChart : a free chart library for the Java(tm) platform
* ===========================================================
*
* (C) Copyright 2000-2004, by Object Refinery Limited and Contributors.
*
* Project Info: http://www.jfree.org/jfreechart/index.html
*
* This library is free software; you can redistribute it and/or modify it under the terms
* of the GNU Lesser General Public License as published by the Free Software Foundation;
* either version 2.1 of the License, or (at your option) any later version.
*
* This library is distributed in the hope that it will be useful, but WITHOUT ANY WARRANTY;
* without even the implied warranty of MERCHANTABILITY or FITNESS FOR A PARTICULAR PURPOSE.
* See the GNU Lesser General Public License for more details.
*
* You should have received a copy of the GNU Lesser General Public License along with this
* library; if not, write to the Free Software Foundation, Inc., 59 Temple Place, Suite 330,
* Boston, MA 02111-1307, USA.
*
* [Java is a trademark or registered trademark of Sun Microsystems, Inc.
* in the United States and other countries.]
*
* -------------------
* LineChartDemo6.java
* -------------------
* (C) Copyright 2004, by Object Refinery Limited and Contributors.
*
* Original Author: David Gilbert (for Object Refinery Limited);
* Contributor(s): -;
*
* $Id: LineChartDemo6.java,v 1.5 2004/04/26 19:11:55 taqua Exp $
*
* Changes
* -------
* 27-Jan-2004 : Version 1 (DG);
*
*/
package org.jfree.chart.demo;
import java.awt.Color;
import org.jfree.chart.ChartFactory;
import org.jfree.chart.ChartPanel;
import org.jfree.chart.JFreeChart;
import org.jfree.chart.axis.NumberAxis;
import org.jfree.chart.plot.PlotOrientation;
import org.jfree.chart.plot.XYPlot;
import org.jfree.chart.renderer.xy.XYLineAndShapeRenderer;
import org.jfree.data.xy.XYDataset;
import org.jfree.data.xy.XYSeries;
import org.jfree.data.xy.XYSeriesCollection;
import org.jfree.ui.ApplicationFrame;
import org.jfree.ui.RefineryUtilities;
import org.jfree.ui.Spacer;
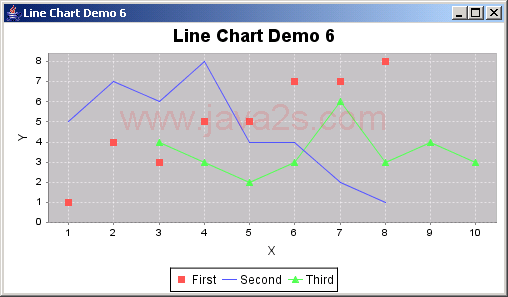
/**
* A simple demonstration application showing how to create a line chart using data from an
* {@link XYDataset}.
*
*/
public class LineChartDemo6 extends ApplicationFrame {
/**
* Creates a new demo.
*
* @param title the frame title.
*/
public LineChartDemo6(final String title) {
super(title);
final XYDataset dataset = createDataset();
final JFreeChart chart = createChart(dataset);
final ChartPanel chartPanel = new ChartPanel(chart);
chartPanel.setPreferredSize(new java.awt.Dimension(500, 270));
setContentPane(chartPanel);
}
/**
* Creates a sample dataset.
*
* @return a sample dataset.
*/
private XYDataset createDataset() {
final XYSeries series1 = new XYSeries("First");
series1.add(1.0, 1.0);
series1.add(2.0, 4.0);
series1.add(3.0, 3.0);
series1.add(4.0, 5.0);
series1.add(5.0, 5.0);
series1.add(6.0, 7.0);
series1.add(7.0, 7.0);
series1.add(8.0, 8.0);
final XYSeries series2 = new XYSeries("Second");
series2.add(1.0, 5.0);
series2.add(2.0, 7.0);
series2.add(3.0, 6.0);
series2.add(4.0, 8.0);
series2.add(5.0, 4.0);
series2.add(6.0, 4.0);
series2.add(7.0, 2.0);
series2.add(8.0, 1.0);
final XYSeries series3 = new XYSeries("Third");
series3.add(3.0, 4.0);
series3.add(4.0, 3.0);
series3.add(5.0, 2.0);
series3.add(6.0, 3.0);
series3.add(7.0, 6.0);
series3.add(8.0, 3.0);
series3.add(9.0, 4.0);
series3.add(10.0, 3.0);
final XYSeriesCollection dataset = new XYSeriesCollection();
dataset.addSeries(series1);
dataset.addSeries(series2);
dataset.addSeries(series3);
return dataset;
}
/**
* Creates a chart.
*
* @param dataset the data for the chart.
*
* @return a chart.
*/
private JFreeChart createChart(final XYDataset dataset) {
// create the chart...
final JFreeChart chart = ChartFactory.createXYLineChart(
"Line Chart Demo 6", // chart title
"X", // x axis label
"Y", // y axis label
dataset, // data
PlotOrientation.VERTICAL,
true, // include legend
true, // tooltips
false // urls
);
// NOW DO SOME OPTIONAL CUSTOMISATION OF THE CHART...
chart.setBackgroundPaint(Color.white);
// final StandardLegend legend = (StandardLegend) chart.getLegend();
// legend.setDisplaySeriesShapes(true);
// get a reference to the plot for further customisation...
final XYPlot plot = chart.getXYPlot();
plot.setBackgroundPaint(Color.lightGray);
// plot.setAxisOffset(new Spacer(Spacer.ABSOLUTE, 5.0, 5.0, 5.0, 5.0));
plot.setDomainGridlinePaint(Color.white);
plot.setRangeGridlinePaint(Color.white);
final XYLineAndShapeRenderer renderer = new XYLineAndShapeRenderer();
renderer.setSeriesLinesVisible(0, false);
renderer.setSeriesShapesVisible(1, false);
plot.setRenderer(renderer);
// change the auto tick unit selection to integer units only...
final NumberAxis rangeAxis = (NumberAxis) plot.getRangeAxis();
rangeAxis.setStandardTickUnits(NumberAxis.createIntegerTickUnits());
// OPTIONAL CUSTOMISATION COMPLETED.
return chart;
}
// ****************************************************************************
// * JFREECHART DEVELOPER GUIDE *
// * The JFreeChart Developer Guide, written by David Gilbert, is available *
// * to purchase from Object Refinery Limited: *
// * *
// * http://www.object-refinery.com/jfreechart/guide.html *
// * *
// * Sales are used to provide funding for the JFreeChart project - please *
// * support us so that we can continue developing free software. *
// ****************************************************************************
/**
* Starting point for the demonstration application.
*
* @param args ignored.
*/
public static void main(final String[] args) {
final LineChartDemo6 demo = new LineChartDemo6("Line Chart Demo 6");
demo.pack();
RefineryUtilities.centerFrameOnScreen(demo);
demo.setVisible(true);
}
}
|