|
/* ===========================================================
* JFreeChart : a free chart library for the Java(tm) platform
* ===========================================================
*
* (C) Copyright 2000-2004, by Object Refinery Limited and Contributors.
*
* Project Info: http://www.jfree.org/jfreechart/index.html
*
* This library is free software; you can redistribute it and/or modify it under the terms
* of the GNU Lesser General Public License as published by the Free Software Foundation;
* either version 2.1 of the License, or (at your option) any later version.
*
* This library is distributed in the hope that it will be useful, but WITHOUT ANY WARRANTY;
* without even the implied warranty of MERCHANTABILITY or FITNESS FOR A PARTICULAR PURPOSE.
* See the GNU Lesser General Public License for more details.
*
* You should have received a copy of the GNU Lesser General Public License along with this
* library; if not, write to the Free Software Foundation, Inc., 59 Temple Place, Suite 330,
* Boston, MA 02111-1307, USA.
*
* [Java is a trademark or registered trademark of Sun Microsystems, Inc.
* in the United States and other countries.]
*
* ------------------
* BarChartDemo3.java
* ------------------
* (C) Copyright 2002-2004, by Object Refinery Limited and Contributors.
*
* Original Author: David Gilbert (for Object Refinery Limited);
* Contributor(s): -;
*
* $Id: BarChartDemo3.java,v 1.15 2004/05/10 16:45:24 mungady Exp $
*
* Changes
* -------
* 22-Aug-2002 : Version 1 (DG);
* 28-Jul-2003 : Updated custom renderer for API changes in 0.9.10 (DG);
* 11-Nov-2003 : Renamed BarChartDemo3.java (DG);
*
*/
package org.jfree.chart.demo;
import java.awt.Color;
import java.awt.Paint;
import org.jfree.chart.ChartFactory;
import org.jfree.chart.ChartPanel;
import org.jfree.chart.JFreeChart;
import org.jfree.chart.axis.NumberAxis;
import org.jfree.chart.axis.ValueAxis;
import org.jfree.chart.labels.ItemLabelAnchor;
import org.jfree.chart.labels.ItemLabelPosition;
import org.jfree.chart.plot.CategoryPlot;
import org.jfree.chart.plot.PlotOrientation;
import org.jfree.chart.renderer.category.BarRenderer;
import org.jfree.chart.renderer.category.CategoryItemRenderer;
import org.jfree.data.category.CategoryDataset;
import org.jfree.data.general.DatasetUtilities;
import org.jfree.ui.ApplicationFrame;
import org.jfree.ui.RefineryUtilities;
import org.jfree.ui.TextAnchor;
/**
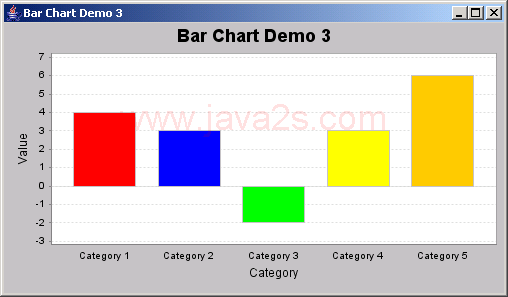
* A bar chart that uses a custom renderer to display different colors within a series.
* No legend is displayed because there is only one series but the colors are not consistent.
*
*/
public class BarChartDemo3 extends ApplicationFrame {
/**
* A custom renderer that returns a different color for each item in a single series.
*/
class CustomRenderer extends BarRenderer {
/** The colors. */
private Paint[] colors;
/**
* Creates a new renderer.
*
* @param colors the colors.
*/
public CustomRenderer(final Paint[] colors) {
this.colors = colors;
}
/**
* Returns the paint for an item. Overrides the default behaviour inherited from
* AbstractSeriesRenderer.
*
* @param row the series.
* @param column the category.
*
* @return The item color.
*/
public Paint getItemPaint(final int row, final int column) {
return this.colors[column % this.colors.length];
}
}
/**
* Creates a new demo.
*
* @param title the frame title.
*/
public BarChartDemo3(final String title) {
super(title);
final CategoryDataset dataset = createDataset();
final JFreeChart chart = createChart(dataset);
final ChartPanel chartPanel = new ChartPanel(chart);
chartPanel.setPreferredSize(new java.awt.Dimension(500, 270));
setContentPane(chartPanel);
}
/**
* Creates a sample dataset.
*
* @return a sample dataset.
*/
private CategoryDataset createDataset() {
final double[][] data = new double[][] {{4.0, 3.0, -2.0, 3.0, 6.0}};
return DatasetUtilities.createCategoryDataset(
"Series ",
"Category ",
data
);
}
/**
* Creates a sample chart.
*
* @param dataset the dataset.
*
* @return a sample chart.
*/
private JFreeChart createChart(final CategoryDataset dataset) {
final JFreeChart chart = ChartFactory.createBarChart(
"Bar Chart Demo 3", // chart title
"Category", // domain axis label
"Value", // range axis label
dataset, // data
PlotOrientation.VERTICAL, // the plot orientation
false, // include legend
true,
false
);
chart.setBackgroundPaint(Color.lightGray);
// get a reference to the plot for further customisation...
final CategoryPlot plot = chart.getCategoryPlot();
plot.setNoDataMessage("NO DATA!");
final CategoryItemRenderer renderer = new CustomRenderer(
new Paint[] {Color.red, Color.blue, Color.green,
Color.yellow, Color.orange, Color.cyan,
Color.magenta, Color.blue}
);
// renderer.setLabelGenerator(new StandardCategoryLabelGenerator());
renderer.setItemLabelsVisible(true);
final ItemLabelPosition p = new ItemLabelPosition(
ItemLabelAnchor.CENTER, TextAnchor.CENTER, TextAnchor.CENTER, 45.0
);
renderer.setPositiveItemLabelPosition(p);
plot.setRenderer(renderer);
// change the margin at the top of the range axis...
final ValueAxis rangeAxis = plot.getRangeAxis();
rangeAxis.setStandardTickUnits(NumberAxis.createIntegerTickUnits());
rangeAxis.setLowerMargin(0.15);
rangeAxis.setUpperMargin(0.15);
return chart;
}
// ****************************************************************************
// * JFREECHART DEVELOPER GUIDE *
// * The JFreeChart Developer Guide, written by David Gilbert, is available *
// * to purchase from Object Refinery Limited: *
// * *
// * http://www.object-refinery.com/jfreechart/guide.html *
// * *
// * Sales are used to provide funding for the JFreeChart project - please *
// * support us so that we can continue developing free software. *
// ****************************************************************************
/**
* Starting point for the demonstration application.
*
* @param args ignored.
*/
public static void main(final String[] args) {
final BarChartDemo3 demo = new BarChartDemo3("Bar Chart Demo 3");
demo.pack();
RefineryUtilities.centerFrameOnScreen(demo);
demo.setVisible(true);
}
}
|