|
import java.awt.*;
import java.util.*;
import javax.swing.*;
import no.geosoft.cc.geometry.Geometry;
import no.geosoft.cc.graphics.*;
/**
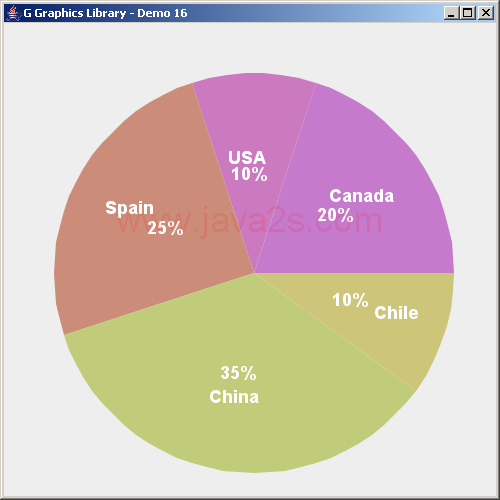
* G demo program. Demonstrates:
*
* <ul>
* <li>A rudimentary pie chart class
* <li>Annotation techniques
* <li>Example geometry generation
* </ul>
*
* @author <a href="mailto:jacob.dreyer@geosoft.no">Jacob Dreyer</a>
*/
public class Demo16 extends JFrame
{
public Demo16()
{
super ("G Graphics Library - Demo 16");
setDefaultCloseOperation (JFrame.EXIT_ON_CLOSE);
// Create the graphic canvas
GWindow window = new GWindow();
getContentPane().add (window.getCanvas());
// Create scane with default viewport and world extent settings
GScene scene = new GScene (window);
GStyle pieStyle = new GStyle();
pieStyle.setFont (new Font ("Dialog", Font.BOLD, 18));
pieStyle.setLineStyle (GStyle.LINESTYLE_INVISIBLE);
pieStyle.setForegroundColor (new Color (255, 255, 255));
PieChart pieChart = new PieChart (250, 250, 200);
pieChart.setStyle (pieStyle);
pieChart.addSector (0.20, "Canada", getStyle());
pieChart.addSector (0.10, "USA", getStyle());
pieChart.addSector (0.25, "Spain", getStyle());
pieChart.addSector (0.35, "China", getStyle());
pieChart.addSector (0.10, "Chile", getStyle());
scene.add (pieChart);
pack();
setSize (new Dimension (500, 500));
setVisible (true);
}
private GStyle getStyle()
{
GStyle style = new GStyle();
style.setBackgroundColor (new Color (Color.HSBtoRGB ((float)Math.random(), 0.4f, 0.8f)));
return style;
}
private class PieChart extends GObject
{
private int x0_, y0_;
private int radius_;
private Collection sectors_;
PieChart (int x0, int y0, int radius)
{
x0_ = x0;
y0_ = y0;
radius_ = radius;
sectors_ = new ArrayList();
}
void addSector (double fraction, String text, GStyle style)
{
sectors_.add (new Sector (fraction, text, style));
}
public void draw()
{
removeSegments();
// Loop through the sectors and draw the graphics for each
double angle0 = 0.0;
for (Iterator i = sectors_.iterator(); i.hasNext(); ) {
Sector sector = (Sector) i.next();
//
// Geometry for the sector itself
//
GSegment segment = new GSegment();
addSegment (segment);
segment.setStyle (sector.style);
double angle1 = angle0 + sector.fraction * Math.PI * 2.0;
int[] sectorGeometry = Geometry.createSector (x0_, y0_, radius_,
angle0, angle1);
segment.setGeometry (sectorGeometry);
angle0 = angle1;
//
// Add annotation. Create an invisible line from the sector center
// thorugh the center of the arc and out and associated annotation
// with this line.
//
double[] p0 = new double[3];
double[] p1 = new double[3];
int nPoints = sectorGeometry.length / 2;
int pointNo = (nPoints - 2) / 2;
p1[0] = sectorGeometry[pointNo * 2 + 0];
p1[1] = sectorGeometry[pointNo * 2 + 1];
p1[2] = 0.0;
double[] sectorCenter = Geometry.computePointOnLine (x0_, y0_,
p1[0], p1[1],
0.5);
p0[0] = sectorCenter[0];
p0[1] = sectorCenter[1];
p0[2] = 0.0;
// Ensure line extends far out of the sector
Geometry.extendLine (p0, p1, 1000.0);
GSegment annotationLine = new GSegment();
addSegment (annotationLine);
annotationLine.setGeometry ((int) p0[0], (int) p0[1],
(int) p1[0], (int) p1[1]);
// Add the percentage text
int percent = (int) Math.round (sector.fraction * 100.0);
GText text = new GText (percent + "%", GPosition.FIRST);
annotationLine.addText (text);
// Add the label to the same geometry point as the percentage;
// It will be adjusted so it doesn't overlap
text = new GText (sector.label, GPosition.FIRST);
annotationLine.addText (text);
}
}
}
private class Sector
{
public double fraction;
public String label;
public GStyle style;
public Sector (double fraction, String label, GStyle style)
{
this.fraction = fraction;
this.label = label;
this.style = style;
}
}
public static void main (String[] args)
{
new Demo16();
}
}
|