|
/* ===========================================================
* JFreeChart : a free chart library for the Java(tm) platform
* ===========================================================
*
* (C) Copyright 2000-2004, by Object Refinery Limited and Contributors.
*
* Project Info: http://www.jfree.org/jfreechart/index.html
*
* This library is free software; you can redistribute it and/or modify it under the terms
* of the GNU Lesser General Public License as published by the Free Software Foundation;
* either version 2.1 of the License, or (at your option) any later version.
*
* This library is distributed in the hope that it will be useful, but WITHOUT ANY WARRANTY;
* without even the implied warranty of MERCHANTABILITY or FITNESS FOR A PARTICULAR PURPOSE.
* See the GNU Lesser General Public License for more details.
*
* You should have received a copy of the GNU Lesser General Public License along with this
* library; if not, write to the Free Software Foundation, Inc., 59 Temple Place, Suite 330,
* Boston, MA 02111-1307, USA.
*
* [Java is a trademark or registered trademark of Sun Microsystems, Inc.
* in the United States and other countries.]
*
* ------------------
* XYLogAxesDemo.java
* ------------------
* (C) Copyright 2002-2004, by Object Refinery Limited and Contributors.
*
* Original Author: David Gilbert (for Object Refinery Limited);
* Contributor(s): Clemens;
*
* $Id: XYLogAxesDemo.java,v 1.14 2004/04/26 19:12:04 taqua Exp $
*
* Changes
* -------
* 31-Jul-2002 : Version 1 (DG);
* 11-Oct-2002 : Fixed issues reported by Checkstyle (DG);
* 31-Jan-2003 : Replaced DefaultXYDataset with XYSeriesCollection (DG);
*
*/
package org.jfree.chart.demo;
import java.awt.Color;
import org.jfree.chart.ChartFactory;
import org.jfree.chart.ChartPanel;
import org.jfree.chart.JFreeChart;
import org.jfree.chart.axis.LogarithmicAxis;
import org.jfree.chart.axis.NumberAxis;
import org.jfree.chart.plot.PlotOrientation;
import org.jfree.chart.plot.XYPlot;
import org.jfree.data.xy.XYSeries;
import org.jfree.data.xy.XYSeriesCollection;
import org.jfree.ui.ApplicationFrame;
import org.jfree.ui.RefineryUtilities;
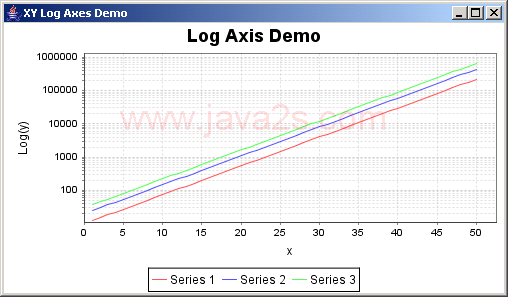
/**
* A demo showing the use of log axes.
*
*/
public class XYLogAxesDemo extends ApplicationFrame {
/**
* Creates a new demo.
*
* @param title the frame title.
*/
public XYLogAxesDemo(final String title) {
super(title);
//Object[][][] data = new Object[3][50][2];
final XYSeries s1 = new XYSeries("Series 1");
final XYSeries s2 = new XYSeries("Series 2");
final XYSeries s3 = new XYSeries("Series 3");
// for (int i = 1; i <= 50; i++) {
// s1.add(i, 1000 * Math.pow(i, -2));
// s2.add(i, 1000 * Math.pow(i, -3));
// s3.add(i, 1000 * Math.pow(i, -4));
// }
for (int i = 1; i <= 50; i++) {
s1.add(i, 10 * Math.exp(i / 5.0));
s2.add(i, 20 * Math.exp(i / 5.0));
s3.add(i, 30 * Math.exp(i / 5.0));
}
final XYSeriesCollection dataset = new XYSeriesCollection();
dataset.addSeries(s1);
dataset.addSeries(s2);
dataset.addSeries(s3);
final JFreeChart chart = ChartFactory.createXYLineChart(
"Log Axis Demo", // chart title
"Category", // domain axis label
"Value", // range axis label
dataset, // data
PlotOrientation.VERTICAL,
true, // include legend
true,
false
);
final XYPlot plot = chart.getXYPlot();
final NumberAxis domainAxis = new NumberAxis("x");
final NumberAxis rangeAxis = new LogarithmicAxis("Log(y)");
plot.setDomainAxis(domainAxis);
plot.setRangeAxis(rangeAxis);
chart.setBackgroundPaint(Color.white);
plot.setOutlinePaint(Color.black);
final ChartPanel chartPanel = new ChartPanel(chart);
chartPanel.setPreferredSize(new java.awt.Dimension(500, 270));
setContentPane(chartPanel);
}
// ****************************************************************************
// * JFREECHART DEVELOPER GUIDE *
// * The JFreeChart Developer Guide, written by David Gilbert, is available *
// * to purchase from Object Refinery Limited: *
// * *
// * http://www.object-refinery.com/jfreechart/guide.html *
// * *
// * Sales are used to provide funding for the JFreeChart project - please *
// * support us so that we can continue developing free software. *
// ****************************************************************************
/**
* Starting point for the demonstration application.
*
* @param args ignored.
*/
public static void main(final String[] args) {
final XYLogAxesDemo demo = new XYLogAxesDemo("XY Log Axes Demo");
demo.pack();
RefineryUtilities.centerFrameOnScreen(demo);
demo.setVisible(true);
}
}
|