|
/* ===========================================================
* JFreeChart : a free chart library for the Java(tm) platform
* ===========================================================
*
* (C) Copyright 2000-2005, by Object Refinery Limited and Contributors.
*
* Project Info: http://www.jfree.org/jfreechart/index.html
*
* This library is free software; you can redistribute it and/or modify it
* under the terms of the GNU Lesser General Public License as published by
* the Free Software Foundation; either version 2.1 of the License, or
* (at your option) any later version.
*
* This library is distributed in the hope that it will be useful, but
* WITHOUT ANY WARRANTY; without even the implied warranty of MERCHANTABILITY
* or FITNESS FOR A PARTICULAR PURPOSE. See the GNU Lesser General Public
* License for more details.
*
* You should have received a copy of the GNU Lesser General Public License
* along with this library; if not, write to the Free Software Foundation,
* Inc., 59 Temple Place, Suite 330, Boston, MA 02111-1307, USA.
*
* [Java is a trademark or registered trademark of Sun Microsystems, Inc.
* in the United States and other countries.]
*
* -------------------------
* TimeSeriesChartDemo1.java
* -------------------------
* (C) Copyright 2003-2005, by Object Refinery Limited and Contributors.
*
* Original Author: David Gilbert (for Object Refinery Limited);
* Contributor(s): ;
*
* $Id: TimeSeriesChartDemo1.java,v 1.2 2005/03/28 19:38:45 mungady Exp $
*
* Changes
* -------
* 09-Mar-2005 : Version 1, copied from the demo collection that ships with
* the JFreeChart Developer Guide (DG);
*
*/
package org.jfree.chart.demo;
import java.awt.Color;
import java.text.SimpleDateFormat;
import javax.swing.JPanel;
import org.jfree.chart.ChartFactory;
import org.jfree.chart.ChartPanel;
import org.jfree.chart.JFreeChart;
import org.jfree.chart.axis.DateAxis;
import org.jfree.chart.plot.XYPlot;
import org.jfree.chart.renderer.xy.XYItemRenderer;
import org.jfree.chart.renderer.xy.XYLineAndShapeRenderer;
import org.jfree.data.time.Month;
import org.jfree.data.time.TimeSeries;
import org.jfree.data.time.TimeSeriesCollection;
import org.jfree.data.xy.XYDataset;
import org.jfree.ui.ApplicationFrame;
import org.jfree.ui.RectangleInsets;
import org.jfree.ui.RefineryUtilities;
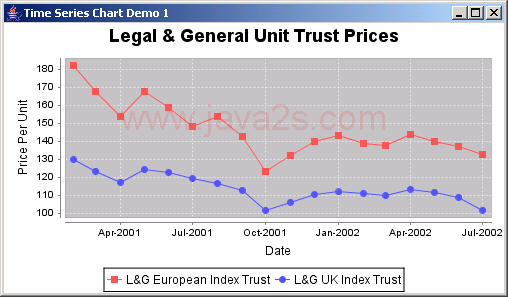
/**
* An example of a time series chart. For the most part, default settings are
* used, except that the renderer is modified to show filled shapes (as well as
* lines) at each data point.
*/
public class TimeSeriesChartDemo1 extends ApplicationFrame {
/**
* A demonstration application showing how to create a simple time series
* chart. This example uses monthly data.
*
* @param title the frame title.
*/
public TimeSeriesChartDemo1(String title) {
super(title);
XYDataset dataset = createDataset();
JFreeChart chart = createChart(dataset);
ChartPanel chartPanel = new ChartPanel(chart, false);
chartPanel.setPreferredSize(new java.awt.Dimension(500, 270));
chartPanel.setMouseZoomable(true, false);
setContentPane(chartPanel);
}
/**
* Creates a chart.
*
* @param dataset a dataset.
*
* @return A chart.
*/
private static JFreeChart createChart(XYDataset dataset) {
JFreeChart chart = ChartFactory.createTimeSeriesChart(
"Legal & General Unit Trust Prices", // title
"Date", // x-axis label
"Price Per Unit", // y-axis label
dataset, // data
true, // create legend?
true, // generate tooltips?
false // generate URLs?
);
chart.setBackgroundPaint(Color.white);
XYPlot plot = (XYPlot) chart.getPlot();
plot.setBackgroundPaint(Color.lightGray);
plot.setDomainGridlinePaint(Color.white);
plot.setRangeGridlinePaint(Color.white);
plot.setAxisOffset(new RectangleInsets(5.0, 5.0, 5.0, 5.0));
plot.setDomainCrosshairVisible(true);
plot.setRangeCrosshairVisible(true);
XYItemRenderer r = plot.getRenderer();
if (r instanceof XYLineAndShapeRenderer) {
XYLineAndShapeRenderer renderer = (XYLineAndShapeRenderer) r;
renderer.setDefaultShapesVisible(true);
renderer.setDefaultShapesFilled(true);
}
DateAxis axis = (DateAxis) plot.getDomainAxis();
axis.setDateFormatOverride(new SimpleDateFormat("MMM-yyyy"));
return chart;
}
/**
* Creates a dataset, consisting of two series of monthly data.
*
* @return The dataset.
*/
private static XYDataset createDataset() {
TimeSeries s1 = new TimeSeries("L&G European Index Trust", Month.class);
s1.add(new Month(2, 2001), 181.8);
s1.add(new Month(3, 2001), 167.3);
s1.add(new Month(4, 2001), 153.8);
s1.add(new Month(5, 2001), 167.6);
s1.add(new Month(6, 2001), 158.8);
s1.add(new Month(7, 2001), 148.3);
s1.add(new Month(8, 2001), 153.9);
s1.add(new Month(9, 2001), 142.7);
s1.add(new Month(10, 2001), 123.2);
s1.add(new Month(11, 2001), 131.8);
s1.add(new Month(12, 2001), 139.6);
s1.add(new Month(1, 2002), 142.9);
s1.add(new Month(2, 2002), 138.7);
s1.add(new Month(3, 2002), 137.3);
s1.add(new Month(4, 2002), 143.9);
s1.add(new Month(5, 2002), 139.8);
s1.add(new Month(6, 2002), 137.0);
s1.add(new Month(7, 2002), 132.8);
TimeSeries s2 = new TimeSeries("L&G UK Index Trust", Month.class);
s2.add(new Month(2, 2001), 129.6);
s2.add(new Month(3, 2001), 123.2);
s2.add(new Month(4, 2001), 117.2);
s2.add(new Month(5, 2001), 124.1);
s2.add(new Month(6, 2001), 122.6);
s2.add(new Month(7, 2001), 119.2);
s2.add(new Month(8, 2001), 116.5);
s2.add(new Month(9, 2001), 112.7);
s2.add(new Month(10, 2001), 101.5);
s2.add(new Month(11, 2001), 106.1);
s2.add(new Month(12, 2001), 110.3);
s2.add(new Month(1, 2002), 111.7);
s2.add(new Month(2, 2002), 111.0);
s2.add(new Month(3, 2002), 109.6);
s2.add(new Month(4, 2002), 113.2);
s2.add(new Month(5, 2002), 111.6);
s2.add(new Month(6, 2002), 108.8);
s2.add(new Month(7, 2002), 101.6);
TimeSeriesCollection dataset = new TimeSeriesCollection();
dataset.addSeries(s1);
dataset.addSeries(s2);
dataset.setDomainIsPointsInTime(true);
return dataset;
}
/**
* Creates a panel for the demo (used by SuperDemo.java).
*
* @return A panel.
*/
public static JPanel createDemoPanel() {
JFreeChart chart = createChart(createDataset());
return new ChartPanel(chart);
}
/**
* Starting point for the demonstration application.
*
* @param args ignored.
*/
public static void main(String[] args) {
TimeSeriesChartDemo1 demo = new TimeSeriesChartDemo1(
"Time Series Chart Demo 1"
);
demo.pack();
RefineryUtilities.centerFrameOnScreen(demo);
demo.setVisible(true);
}
}
|