|
/* ===========================================================
* JFreeChart : a free chart library for the Java(tm) platform
* ===========================================================
*
* (C) Copyright 2000-2004, by Object Refinery Limited and Contributors.
*
* Project Info: http://www.jfree.org/jfreechart/index.html
*
* This library is free software; you can redistribute it and/or modify it under the terms
* of the GNU Lesser General Public License as published by the Free Software Foundation;
* either version 2.1 of the License, or (at your option) any later version.
*
* This library is distributed in the hope that it will be useful, but WITHOUT ANY WARRANTY;
* without even the implied warranty of MERCHANTABILITY or FITNESS FOR A PARTICULAR PURPOSE.
* See the GNU Lesser General Public License for more details.
*
* You should have received a copy of the GNU Lesser General Public License along with this
* library; if not, write to the Free Software Foundation, Inc., 59 Temple Place, Suite 330,
* Boston, MA 02111-1307, USA.
*
* [Java is a trademark or registered trademark of Sun Microsystems, Inc.
* in the United States and other countries.]
*
* ----------------------------
* StatisticalBarChartDemo.java
* ----------------------------
* (C) Copyright 2002-2004, by Pascal Collet and Contributors.
*
* Original Author: Pascal Collet;
* Contributor(s): David Gilbert (for Object Refinery Limited);
*
* $Id: StatisticalBarChartDemo.java,v 1.15 2004/05/07 15:51:37 mungady Exp $
*
* Changes
* -------
* 21-Aug-2002 : Version 1, contributed by Pascal Collet (DG);
* 11-Oct-2002 : Fixed errors reported by Checkstyle (DG);
* 05-Feb-2003 : Updated for documentation (DG);
*
*/
package org.jfree.chart.demo;
import java.awt.Font;
import org.jfree.chart.ChartPanel;
import org.jfree.chart.JFreeChart;
import org.jfree.chart.axis.CategoryAxis;
import org.jfree.chart.axis.NumberAxis;
import org.jfree.chart.axis.ValueAxis;
import org.jfree.chart.plot.CategoryPlot;
import org.jfree.chart.renderer.category.CategoryItemRenderer;
import org.jfree.chart.renderer.category.StatisticalBarRenderer;
import org.jfree.data.statistics.DefaultStatisticalCategoryDataset;
import org.jfree.data.statistics.StatisticalCategoryDataset;
import org.jfree.ui.ApplicationFrame;
import org.jfree.ui.RefineryUtilities;
/**
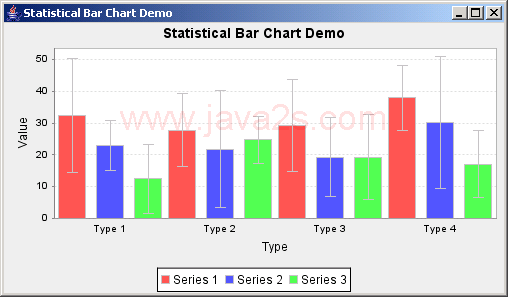
* Demonstration of the statistical bar graph.
*
* @author Pascal Collet
*/
public class StatisticalBarChartDemo extends ApplicationFrame {
/**
* Creates a new demo.
*
* @param title the frame title.
*/
public StatisticalBarChartDemo(final String title) {
super(title);
final StatisticalCategoryDataset dataset = createDataset();
final CategoryAxis xAxis = new CategoryAxis("Type");
xAxis.setLowerMargin(0.01d); // percentage of space before first bar
xAxis.setUpperMargin(0.01d); // percentage of space after last bar
xAxis.setCategoryMargin(0.05d); // percentage of space between categories
final ValueAxis yAxis = new NumberAxis("Value");
// define the plot
final CategoryItemRenderer renderer = new StatisticalBarRenderer();
final CategoryPlot plot = new CategoryPlot(dataset, xAxis, yAxis, renderer);
final JFreeChart chart = new JFreeChart("Statistical Bar Chart Demo",
new Font("Helvetica", Font.BOLD, 14),
plot,
true);
//chart.setBackgroundPaint(Color.white);
// add the chart to a panel...
final ChartPanel chartPanel = new ChartPanel(chart);
chartPanel.setPreferredSize(new java.awt.Dimension(500, 270));
setContentPane(chartPanel);
}
// ****************************************************************************
// * JFREECHART DEVELOPER GUIDE *
// * The JFreeChart Developer Guide, written by David Gilbert, is available *
// * to purchase from Object Refinery Limited: *
// * *
// * http://www.object-refinery.com/jfreechart/guide.html *
// * *
// * Sales are used to provide funding for the JFreeChart project - please *
// * support us so that we can continue developing free software. *
// ****************************************************************************
/**
* Creates a sample dataset.
*
* @return The dataset.
*/
private StatisticalCategoryDataset createDataset() {
final DefaultStatisticalCategoryDataset result = new DefaultStatisticalCategoryDataset();
result.add(32.5, 17.9, "Series 1", "Type 1");
result.add(27.8, 11.4, "Series 1", "Type 2");
result.add(29.3, 14.4, "Series 1", "Type 3");
result.add(37.9, 10.3, "Series 1", "Type 4");
result.add(22.9, 7.9, "Series 2", "Type 1");
result.add(21.8, 18.4, "Series 2", "Type 2");
result.add(19.3, 12.4, "Series 2", "Type 3");
result.add(30.3, 20.7, "Series 2", "Type 4");
result.add(12.5, 10.9, "Series 3", "Type 1");
result.add(24.8, 7.4, "Series 3", "Type 2");
result.add(19.3, 13.4, "Series 3", "Type 3");
result.add(17.1, 10.6, "Series 3", "Type 4");
return result;
}
/**
* For testing from the command line.
*
* @param args ignored.
*/
public static void main(final String[] args) {
final StatisticalBarChartDemo demo = new StatisticalBarChartDemo(
"Statistical Bar Chart Demo"
);
demo.pack();
RefineryUtilities.centerFrameOnScreen(demo);
demo.setVisible(true);
}
}
|