|
/* ===========================================================
* JFreeChart : a free chart library for the Java(tm) platform
* ===========================================================
*
* (C) Copyright 2000-2004, by Object Refinery Limited and Contributors.
*
* Project Info: http://www.jfree.org/jfreechart/index.html
*
* This library is free software; you can redistribute it and/or modify it under the terms
* of the GNU Lesser General Public License as published by the Free Software Foundation;
* either version 2.1 of the License, or (at your option) any later version.
*
* This library is distributed in the hope that it will be useful, but WITHOUT ANY WARRANTY;
* without even the implied warranty of MERCHANTABILITY or FITNESS FOR A PARTICULAR PURPOSE.
* See the GNU Lesser General Public License for more details.
*
* You should have received a copy of the GNU Lesser General Public License along with this
* library; if not, write to the Free Software Foundation, Inc., 59 Temple Place, Suite 330,
* Boston, MA 02111-1307, USA.
*
* [Java is a trademark or registered trademark of Sun Microsystems, Inc.
* in the United States and other countries.]
*
* ------------------------------
* SegmentedHighLowChartDemo.java
* ------------------------------
* (C) Copyright 2003, 2004, by Bill Kelemen and Contributors.
*
* Original Author: Bill Kelemen;
* Contributor(s): David Gilbert (for Object Refinery Limited);
*
* $Id: SegmentedHighLowChartDemo.java,v 1.11 2004/04/26 19:12:03 taqua Exp $
*
* Changes
* -------
* 24-May-2003 : Version 1 (BK);
* 12-Nov-2003 : Added roll factor to tick units to improve labelling on date axis (DG);
*
*/
package org.jfree.chart.demo;
import java.text.SimpleDateFormat;
import java.util.Calendar;
import org.jfree.chart.ChartFactory;
import org.jfree.chart.ChartPanel;
import org.jfree.chart.JFreeChart;
import org.jfree.chart.axis.DateAxis;
import org.jfree.chart.axis.DateTickUnit;
import org.jfree.chart.axis.NumberAxis;
import org.jfree.chart.axis.SegmentedTimeline;
import org.jfree.chart.axis.TickUnits;
import org.jfree.data.xy.DefaultHighLowDataset;
import org.jfree.ui.ApplicationFrame;
import org.jfree.ui.RefineryUtilities;
/**
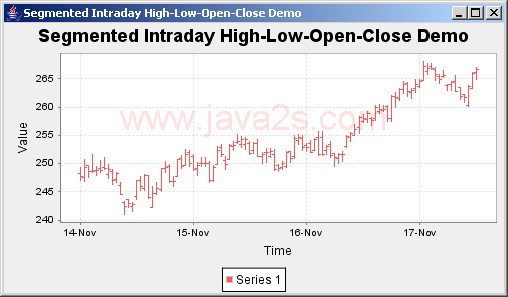
* A demo showing a daily and intraday segmented high-low-open-close charts.
*
* @author Bill Kelemen
*/
public class SegmentedHighLowChartDemo extends ApplicationFrame {
/**
* A demonstration application showing a high-low-open-close chart using a
* segmented or non-segmented axis.
*
* @param title the frame title.
* @param useSegmentedAxis use a segmented axis for this demo?
* @param timelineType Type of timeline to use: 1=Monday through Friday, 2=Intraday
*/
public SegmentedHighLowChartDemo(final String title,
final boolean useSegmentedAxis,
final int timelineType) {
super(title);
System.out.println("\nMaking SegmentedHighLowChartDemo(" + title + ")");
// create a Calendar object with today's date at midnight
final Calendar cal = Calendar.getInstance();
cal.set(Calendar.HOUR_OF_DAY, 0);
cal.set(Calendar.MINUTE, 0);
cal.set(Calendar.SECOND, 0);
cal.set(Calendar.MILLISECOND, 0);
// create a timeline for the demo
SegmentedTimeline timeline = null;
switch (timelineType) {
case 1:
timeline = SegmentedTimeline.newMondayThroughFridayTimeline();
break;
case 2:
timeline = SegmentedTimeline.newFifteenMinuteTimeline();
final Calendar cal2 = (Calendar) cal.clone();
cal2.add(Calendar.YEAR, 1);
// add 1 year of baseTimeline's excluded segments (Saturdays and Sundays) as
// exceptions of the intraday timeline
timeline.addBaseTimelineExclusions(cal.getTime().getTime(),
cal2.getTime().getTime());
break;
default:
System.out.println("Invalid timelineType.");
System.exit(1);
}
// create a data set that has data for trading days (Monday through Friday).
final DefaultHighLowDataset dataset =
DemoDatasetFactory.createSegmentedHighLowDataset(timeline, cal.getTime());
final JFreeChart chart;
if (useSegmentedAxis) {
chart = ChartFactory.createHighLowChart(
title,
"Time", "Value",
dataset, timeline, true);
}
else {
chart = ChartFactory.createHighLowChart(
title,
"Time", "Value",
dataset, true);
}
final DateAxis axis = (DateAxis) chart.getXYPlot().getDomainAxis();
axis.setAutoRange(true);
final TickUnits units = new TickUnits();
units.add(new DateTickUnit(DateTickUnit.DAY, 1, DateTickUnit.HOUR, 1,
new SimpleDateFormat("d-MMM")));
units.add(new DateTickUnit(DateTickUnit.DAY, 2, DateTickUnit.HOUR, 1,
new SimpleDateFormat("d-MMM")));
units.add(new DateTickUnit(DateTickUnit.DAY, 7, DateTickUnit.DAY, 1,
new SimpleDateFormat("d-MMM")));
units.add(new DateTickUnit(DateTickUnit.DAY, 15, DateTickUnit.DAY, 1,
new SimpleDateFormat("d-MMM")));
units.add(new DateTickUnit(DateTickUnit.DAY, 30, DateTickUnit.DAY, 1,
new SimpleDateFormat("d-MMM")));
axis.setStandardTickUnits(units);
final NumberAxis vaxis = (NumberAxis) chart.getXYPlot().getRangeAxis();
vaxis.setAutoRangeIncludesZero(false);
final ChartPanel chartPanel = new ChartPanel(chart);
chartPanel.setPreferredSize(new java.awt.Dimension(500, 270));
setContentPane(chartPanel);
}
// ****************************************************************************
// * COMMERCIAL SUPPORT / JFREECHART DEVELOPER GUIDE *
// * Please note that commercial support and documentation is available from: *
// * *
// * http://www.object-refinery.com/jfreechart/support.html *
// * *
// * This is not only a great service for developers, but is a VERY IMPORTANT *
// * source of funding for the JFreeChart project. Please support us so that *
// * we can continue developing free software. *
// ****************************************************************************
/**
* Starting point for the demonstration application.
*
* @param args ignored.
*/
public static void main(final String[] args) {
final ApplicationFrame[][] frame = new ApplicationFrame[2][2];
frame[0][0] = new SegmentedHighLowChartDemo("Segmented Daily High-Low-Open-Close Demo",
true, 1);
frame[1][0] = new SegmentedHighLowChartDemo("Normal Daily High-Low-Open-Close Demo",
false, 1);
frame[0][1] = new SegmentedHighLowChartDemo("Segmented Intraday High-Low-Open-Close Demo",
true, 2);
frame[1][1] = new SegmentedHighLowChartDemo("Normal Intraday High-Low-Open-Close Demo",
false, 2);
for (int i = 0; i < 2; i++) {
for (int j = 0; j < 2; j++) {
frame[i][j].pack();
RefineryUtilities.positionFrameOnScreen(frame[i][j], .15 + .70 * j, .25 + .50 * i);
frame[i][j].setVisible(true);
}
}
}
}
|