|
/* ===========================================================
* JFreeChart : a free chart library for the Java(tm) platform
* ===========================================================
*
* (C) Copyright 2000-2004, by Object Refinery Limited and Contributors.
*
* Project Info: http://www.jfree.org/jfreechart/index.html
*
* This library is free software; you can redistribute it and/or modify it under the terms
* of the GNU Lesser General Public License as published by the Free Software Foundation;
* either version 2.1 of the License, or (at your option) any later version.
*
* This library is distributed in the hope that it will be useful, but WITHOUT ANY WARRANTY;
* without even the implied warranty of MERCHANTABILITY or FITNESS FOR A PARTICULAR PURPOSE.
* See the GNU Lesser General Public License for more details.
*
* You should have received a copy of the GNU Lesser General Public License along with this
* library; if not, write to the Free Software Foundation, Inc., 59 Temple Place, Suite 330,
* Boston, MA 02111-1307, USA.
*
* [Java is a trademark or registered trademark of Sun Microsystems, Inc.
* in the United States and other countries.]
*
* --------------------
* ParetoChartDemo.java
* --------------------
* (C) Copyright 2003, 2004, by Object Refinery Limited.
*
* Original Author: David Gilbert (for Object Refinery Limited).
* Contributor(s): -;
*
* $Id: ParetoChartDemo.java,v 1.21 2004/04/30 11:18:56 mungady Exp $
*
* Changes
* -------
* 05-Mar-2003 : Version 1 (DG);
* 27-Aug-2003 : Moved SortOrder from org.jfree.data --> org.jfree.util (DG);
*
*/
package org.jfree.chart.demo;
import java.awt.Color;
import java.text.NumberFormat;
import org.jfree.chart.ChartFactory;
import org.jfree.chart.ChartPanel;
import org.jfree.chart.JFreeChart;
import org.jfree.chart.axis.CategoryAxis;
import org.jfree.chart.axis.NumberAxis;
import org.jfree.chart.plot.CategoryPlot;
import org.jfree.chart.plot.DatasetRenderingOrder;
import org.jfree.chart.plot.PlotOrientation;
import org.jfree.chart.renderer.category.LineAndShapeRenderer;
import org.jfree.chart.title.TextTitle;
import org.jfree.data.DataUtilities;
import org.jfree.data.DefaultKeyedValues;
import org.jfree.data.KeyedValues;
import org.jfree.data.category.CategoryDataset;
import org.jfree.data.general.DatasetUtilities;
import org.jfree.ui.ApplicationFrame;
import org.jfree.ui.RefineryUtilities;
import org.jfree.util.SortOrder;
/**
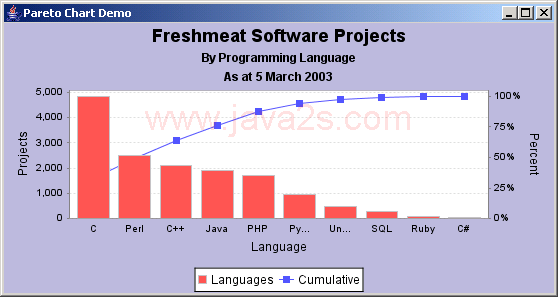
* A demo showing the creation of a pareto chart.
*
*/
public class ParetoChartDemo extends ApplicationFrame {
/**
* Creates a new demo instance.
*
* @param title the frame title.
*/
public ParetoChartDemo(final String title) {
super(title);
final DefaultKeyedValues data = new DefaultKeyedValues();
data.addValue("C", new Integer(4843));
data.addValue("C++", new Integer(2098));
data.addValue("C#", new Integer(26));
data.addValue("Java", new Integer(1901));
data.addValue("Perl", new Integer(2507));
data.addValue("PHP", new Integer(1689));
data.addValue("Python", new Integer(948));
data.addValue("Ruby", new Integer(100));
data.addValue("SQL", new Integer(263));
data.addValue("Unix Shell", new Integer(485));
data.sortByValues(SortOrder.DESCENDING);
final KeyedValues cumulative = DataUtilities.getCumulativePercentages(data);
final CategoryDataset dataset = DatasetUtilities.createCategoryDataset("Languages", data);
// create the chart...
final JFreeChart chart = ChartFactory.createBarChart(
"Freshmeat Software Projects", // chart title
"Language", // domain axis label
"Projects", // range axis label
dataset, // data
PlotOrientation.VERTICAL,
true, // include legend
true,
false
);
// NOW DO SOME OPTIONAL CUSTOMISATION OF THE CHART...
chart.addSubtitle(new TextTitle("By Programming Language"));
chart.addSubtitle(new TextTitle("As at 5 March 2003"));
// set the background color for the chart...
chart.setBackgroundPaint(new Color(0xBBBBDD));
// get a reference to the plot for further customisation...
final CategoryPlot plot = chart.getCategoryPlot();
final CategoryAxis domainAxis = plot.getDomainAxis();
domainAxis.setLowerMargin(0.02);
domainAxis.setUpperMargin(0.02);
// set the range axis to display integers only...
final NumberAxis rangeAxis = (NumberAxis) plot.getRangeAxis();
rangeAxis.setStandardTickUnits(NumberAxis.createIntegerTickUnits());
final LineAndShapeRenderer renderer2 = new LineAndShapeRenderer();
final CategoryDataset dataset2 = DatasetUtilities.createCategoryDataset(
"Cumulative", cumulative
);
final NumberAxis axis2 = new NumberAxis("Percent");
axis2.setNumberFormatOverride(NumberFormat.getPercentInstance());
plot.setRangeAxis(1, axis2);
plot.setDataset(1, dataset2);
plot.setRenderer(1, renderer2);
plot.mapDatasetToRangeAxis(1, 1);
plot.setDatasetRenderingOrder(DatasetRenderingOrder.REVERSE);
// OPTIONAL CUSTOMISATION COMPLETED.
// add the chart to a panel...
final ChartPanel chartPanel = new ChartPanel(chart);
chartPanel.setPreferredSize(new java.awt.Dimension(550, 270));
setContentPane(chartPanel);
}
// ****************************************************************************
// * JFREECHART DEVELOPER GUIDE *
// * The JFreeChart Developer Guide, written by David Gilbert, is available *
// * to purchase from Object Refinery Limited: *
// * *
// * http://www.object-refinery.com/jfreechart/guide.html *
// * *
// * Sales are used to provide funding for the JFreeChart project - please *
// * support us so that we can continue developing free software. *
// ****************************************************************************
/**
* Starting point for the demonstration application.
*
* @param args ignored.
*/
public static void main(final String[] args) {
final ParetoChartDemo demo = new ParetoChartDemo("Pareto Chart Demo");
demo.pack();
RefineryUtilities.centerFrameOnScreen(demo);
demo.setVisible(true);
}
}
|