|
/* ===========================================================
* JFreeChart : a free chart library for the Java(tm) platform
* ===========================================================
*
* (C) Copyright 2000-2004, by Object Refinery Limited and Contributors.
*
* Project Info: http://www.jfree.org/jfreechart/index.html
*
* This library is free software; you can redistribute it and/or modify it under the terms
* of the GNU Lesser General Public License as published by the Free Software Foundation;
* either version 2.1 of the License, or (at your option) any later version.
*
* This library is distributed in the hope that it will be useful, but WITHOUT ANY WARRANTY;
* without even the implied warranty of MERCHANTABILITY or FITNESS FOR A PARTICULAR PURPOSE.
* See the GNU Lesser General Public License for more details.
*
* You should have received a copy of the GNU Lesser General Public License along with this
* library; if not, write to the Free Software Foundation, Inc., 59 Temple Place, Suite 330,
* Boston, MA 02111-1307, USA.
*
* [Java is a trademark or registered trademark of Sun Microsystems, Inc.
* in the United States and other countries.]
*
* ----------------------
* CompassFormatDemo.java
* ----------------------
* (C) Copyright 2004, by Object Refinery Limited and Contributors.
*
* Original Author: David Gilbert (for Object Refinery Limited);
* Contributor(s): -;
*
* $Id: CompassFormatDemo.java,v 1.4 2004/04/27 14:53:09 mungady Exp $
*
* Changes
* -------
* 18-Feb-2004 : Version 1 (DG);
*
*/
package org.jfree.chart.demo;
import java.awt.Color;
import org.jfree.chart.ChartFactory;
import org.jfree.chart.ChartPanel;
import org.jfree.chart.JFreeChart;
import org.jfree.chart.axis.CompassFormat;
import org.jfree.chart.axis.NumberAxis;
import org.jfree.chart.axis.NumberTickUnit;
import org.jfree.chart.axis.TickUnits;
import org.jfree.chart.axis.ValueAxis;
import org.jfree.chart.plot.XYPlot;
import org.jfree.chart.renderer.xy.XYAreaRenderer;
import org.jfree.chart.renderer.xy.XYItemRenderer;
import org.jfree.data.time.Minute;
import org.jfree.data.time.RegularTimePeriod;
import org.jfree.data.time.TimeSeries;
import org.jfree.data.time.TimeSeriesCollection;
import org.jfree.data.xy.XYDataset;
import org.jfree.ui.ApplicationFrame;
import org.jfree.ui.RefineryUtilities;
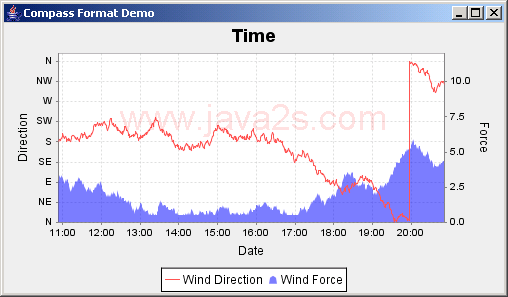
/**
* A demo of the {@link CompassFormat} class.
*
*/
public class CompassFormatDemo extends ApplicationFrame {
/**
* Creates a new demo instance.
*
* @param title the frame title.
*/
public CompassFormatDemo(final String title) {
super(title);
final JFreeChart chart = createChart();
final ChartPanel chartPanel = new ChartPanel(chart);
chartPanel.setPreferredSize(new java.awt.Dimension(500, 270));
setContentPane(chartPanel);
}
// ****************************************************************************
// * JFREECHART DEVELOPER GUIDE *
// * The JFreeChart Developer Guide, written by David Gilbert, is available *
// * to purchase from Object Refinery Limited: *
// * *
// * http://www.object-refinery.com/jfreechart/guide.html *
// * *
// * Sales are used to provide funding for the JFreeChart project - please *
// * support us so that we can continue developing free software. *
// ****************************************************************************
/**
* Creates a sample dataset.
*
* @param count the item count.
*
* @return the dataset.
*/
private XYDataset createDirectionDataset(final int count) {
final TimeSeriesCollection dataset = new TimeSeriesCollection();
final TimeSeries s1 = new TimeSeries("Wind Direction", Minute.class);
RegularTimePeriod start = new Minute();
double direction = 180.0;
for (int i = 0; i < count; i++) {
s1.add(start, direction);
start = start.next();
direction = direction + (Math.random() - 0.5) * 15.0;
if (direction < 0.0) {
direction = direction + 360.0;
}
else if (direction > 360.0) {
direction = direction - 360.0;
}
}
dataset.addSeries(s1);
return dataset;
}
/**
* Creates a sample dataset.
*
* @param count the item count.
*
* @return the dataset.
*/
private XYDataset createForceDataset(final int count) {
final TimeSeriesCollection dataset = new TimeSeriesCollection();
final TimeSeries s1 = new TimeSeries("Wind Force", Minute.class);
RegularTimePeriod start = new Minute();
double force = 3.0;
for (int i = 0; i < count; i++) {
s1.add(start, force);
start = start.next();
force = Math.max(0.5, force + (Math.random() - 0.5) * 0.5);
}
dataset.addSeries(s1);
return dataset;
}
/**
* Creates a sample chart.
*
* @return a sample chart.
*/
private JFreeChart createChart() {
final XYDataset direction = createDirectionDataset(600);
final JFreeChart chart = ChartFactory.createTimeSeriesChart(
"Time",
"Date",
"Direction",
direction,
true,
true,
false
);
final XYPlot plot = chart.getXYPlot();
plot.getDomainAxis().setLowerMargin(0.0);
plot.getDomainAxis().setUpperMargin(0.0);
// configure the range axis to display directions...
final NumberAxis rangeAxis = (NumberAxis) plot.getRangeAxis();
rangeAxis.setAutoRangeIncludesZero(false);
final TickUnits units = new TickUnits();
units.add(new NumberTickUnit(180.0, new CompassFormat()));
units.add(new NumberTickUnit(90.0, new CompassFormat()));
units.add(new NumberTickUnit(45.0, new CompassFormat()));
units.add(new NumberTickUnit(22.5, new CompassFormat()));
rangeAxis.setStandardTickUnits(units);
// add the wind force with a secondary dataset/renderer/axis
plot.setRangeAxis(rangeAxis);
final XYItemRenderer renderer2 = new XYAreaRenderer();
final ValueAxis axis2 = new NumberAxis("Force");
axis2.setRange(0.0, 12.0);
renderer2.setSeriesPaint(0, new Color(0, 0, 255, 128));
plot.setDataset(1, createForceDataset(600));
plot.setRenderer(1, renderer2);
plot.setRangeAxis(1, axis2);
plot.mapDatasetToRangeAxis(1, 1);
return chart;
}
/**
* Starting point for the demonstration application.
*
* @param args ignored.
*/
public static void main(final String[] args) {
final CompassFormatDemo demo = new CompassFormatDemo("Compass Format Demo");
demo.pack();
RefineryUtilities.centerFrameOnScreen(demo);
demo.setVisible(true);
}
}
|